What is a Good Net Promoter Score?

Ever since the Net Promoter Score (NPS) Metric was introduced in the early 2000’s, businesses have always been keen to know if they have a “good” score. Nervous CEOs and business owners may desperately quiz their marketing staff about the score in the hopes it can answer the question, “Just how popular are we and do people like our product?”.
At its heart, the NPS is quite a simple number to calculate. If you need a refresher, we’ve gone into more detail here covering how to measure your NPS, but you use the following formula:
NPS = % Positive reviews - % Negative reviews
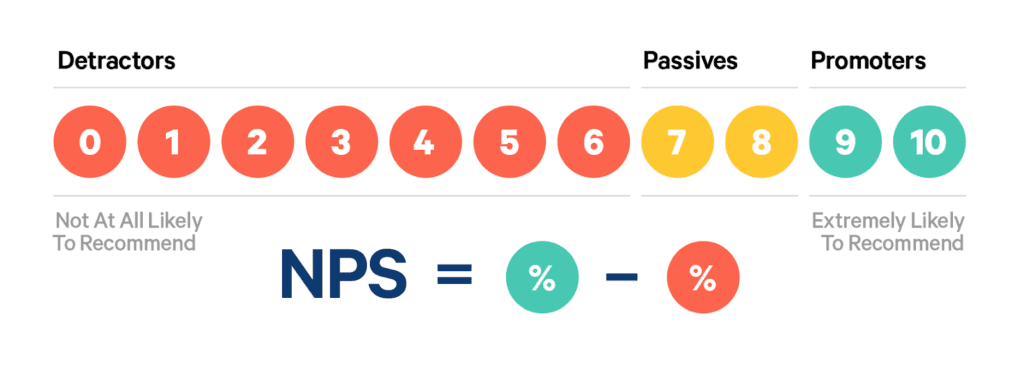
So using a basic example, if you have 50% positive reviews and 20% negative reviews, you’d get an NPS of 30. The score can theoretically run from +100 all the way to -100 if you have 100% reviews either way.
Now, while this sounds simple in principle, it’s actually far more complicated to say what a “good” score actually is, and unfortunately there isn’t a golden number to aim for that we can apply to every business. (Unless you’ve somehow managed to get an NPS of +100, then well done, we’d love to know your secret!)
NPS Score Benchmark – What Is Considered Good
The only general rule to follow is that a bad Net Promoter Score is anything below zero and a good score is anything above.
Anything above basically means you’re getting more positive reviews than negative and vice versa. However (and we can’t stress this enough) a good NPS always depends on the context.
In case your NPS isn't where you'd like it to be, have a look at these 7 ways to improve NPS.
There are several different factors to consider before you land on your own good NPS. We’ll now guide you through how you can interpret yours, the steps to keep in mind and look through some handy benchmark scores of some big name companies and industries to help you put things in context.
A more detailed walk-through of average NPS score by industry is also available.
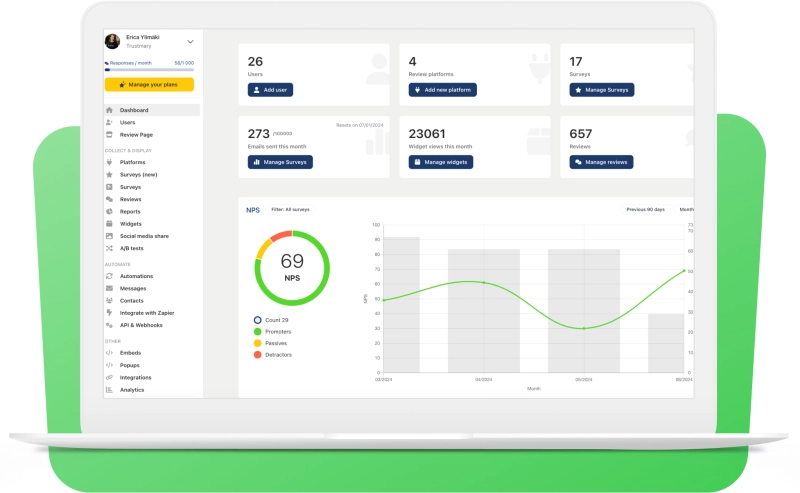
Looking for a tool to measure your NPS?
Book a meeting to try out our NPS tool!
Step 1 - Compare Net Promoter Score by Industry Average
Whether you’re a brand new company running your first ever NPS or a big name player who's been doing this for years, you should always compare your score to direct competitors in your industry.
There is enormous variation in scores across different industries and what is a “good” NPS in one will be completely different in another.
Industry benchmarks are often completed annually by a number of different organisations, and the data compiled by Satmetrix below in December 2019 on US net promoter benchmarks really helps to highlight this variation by industry:
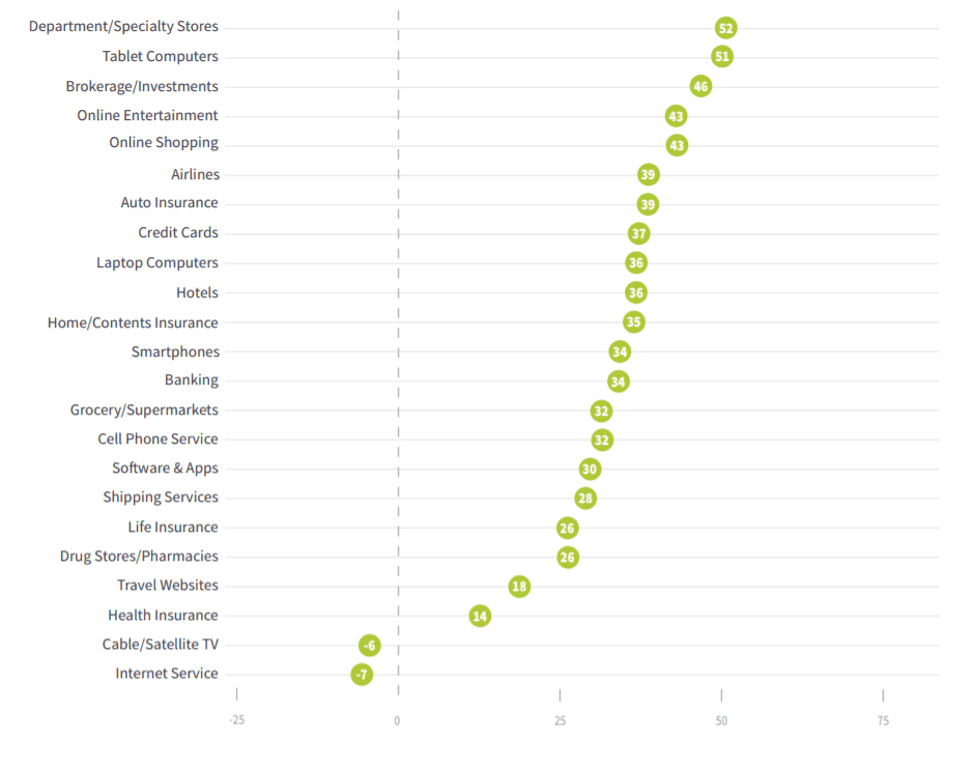
As we can see, internet service providers are sitting at the bottom of the pile on a paltry -7 (and let's be honest, who hasn’t had a run in with their internet provider at some point?) while specialty stores are riding high on+52.
So a basic analysis tells any internet service provider who actually manages to make it above zero would be considered good, at least in comparison to their competitors, while any specialty store scoring in the 1 to 10 range would definitely be considered a poor performer by their peers.
So, if you’re running a coffee shop for example, it just wouldn’t make sense at all to compare yourself to the internet provider score or any other industry not related to you. Their “good” isn’t your “good”.
Some common advice you might hear when trying to interpret a “good” NPS is, “Anything above 0 as good, higher than 50 is excellent and more than 70 is world class” But note how only two industries on the list would be considered excellent by this metric, and what a huge disparity there is between industries in the “good” category.
So does this mean that everything is fine? Because most industries are between 0 and 50 they can rest easy and know they have a “good” score? While those few on a negative score are about to flounder and go under due to terrible customer service and a “bad” NPS?
Of course not. If there’s one point we can’t stress enough here is that “good” is relative when it comes to NPS. Always start with the industry comparison where possible. Once you have a starting point then you can analyse things a little deeper as we’ll see next.
Step 2 - Benchmark Yourself Against the Best (and Worst) in Your Specific Industry
Now you’ve got a good starting point with the industry average you can really start to more clearly define what good means for you.
Try and find out which of your competitors has the best NPS and set your own benchmark against that. A good NPS for you could be to land within a certain number of points of that score each year.
Let’s stay with that coffee house example we mentioned earlier in point one. Now, two of the biggest coffeehouses in the US are Starbucks and Dunkin’ Donuts. Whose scores currently sit at an excellent 77 for Starbucks and a not so great looking 9 for Dunkin’ Donuts.
This massive disparity even within industries can make it even harder to interpret a good score and what all of this tells us is that a good NPS isn’t an exact science. You’re going to need to apply your own benchmarks based on your subjective interpretation of the data.
If you run your own coffee shop (and using the scores above) you at the very least now know what excellent and bad look like within the industry. Using this you can then come up with your own scores that might look a little something like this:
Terrible -10 and below to +15
Bad +15 to +30
OK +30 to +45
Good +45 to +60
Excellent +60 and above
Again though, we should emphasize that comparison benchmarks are what you make of them. If you just use an industry average you might not be able to zero in on your specific strengths are weakness. Try and compare yourself to as many individual competitors as possible.
- How are they collecting feedback?
- Which regions are they operating in?
- What strengths and weaknesses are affecting their score?
Collect as much data as you can before you decide on a good score that works well for you.
But, what if you have few competitors to compare to? Or there is no industry average to be found for your business? What’s a good NPS for you then?
Step 3 - Benchmark Against Yourself
If you work in a smaller industry or produce a very niche product, then it’s going to be very difficult to find an industry wide NPS to get started from.
You may even have trouble even finding individual comparisons depending on the industry you’re in as organisations often only find it viable to do benchmarking on big industries and the big players in them.
Our advice then is to look at your score in isolation. Make yourself your own competitor to benchmark against.
While this might seem counterintuitive at first, it can actually be a very useful way to measure what good looks like. A good example to illustrate this would be looking at the current NPS for the big social media sites which are as follows:
Facebook -21
Twitter 3
Linkedin 5
Instagram 64
Now, all of these are social media sites, but because each one has a unique offering within a niche, it doesn’t make sense to take such wildly differing scores and pluck out an average. We can further emphasise this point when we realise that Facebook currently has 2.5 billion users and is growing all of the time. It shows us such a seemingly poor NPS is doing little to hamper growth meaning it’s incredibly difficult to define what “good” is by using direct comparisons.
It's a whole different story, for example, for small digital marketing agencies, investment firms and health insurance companies.
Most Industry Leaders Forget that...
... it makes much more sense to focus on your own NPS score in isolation, to review and analyze the NPS regularly. Look more specifically at what the customer feedback is telling you and whether there are any specific issues that need addressing.
A good NPS score in this instance would be one that shows steady improvement over time and one that demonstrably evidences improved customer service.
This doesn’t just apply to giants like Facebook either, it can also help if you’re running a small local business. If your competition is just around the corner then that’s who your benchmark should be, not the industry average.
Given it might also be difficult to get the NPS of your other local competitors, then once again we find comparing against yourself and measuring consistent improvement over time works better for you.
Additional Points to Keep in Mind
You’ve hopefully got a good idea of where to get started on your own NPS now and figuring out what good means to you. However, there are a few additional points it’s worth bearing in mind before you come to a final number:
- Geographic location - Different areas and different countries often rate products and companies differently. European customers tend to score more conservatively than their North American counterparts. When looking at your own NPS try to keep comparisons to within your region.
- Characteristics of the respondents - NPS variations can even come from characteristics like gender and age for example. Analyse your feedback, which age group are you getting most responses from and do responses differ across demographics?
- How information was collected - Whether by text, email, phone call, post or any other method, this can also have a bearing on who responds and how likely they are to respond. Are you finding more traction with one avenue over another?
- It might be harder to get good scores than you think - There is lot of conflicting data on what is a good score for NPS. As an example, B2B focused Deep-Insight analyzed in their blog based on their data that +10% is average NPS for B2B companies and +30% is already truly excellent.
The best way to get an accurate good score is to lock down as many of the variables that you can where possible. While you can’t always know the responses your competitors are getting, you can definitely analyze your own customers by as many metrics as you’d like and see if any trends are present.
No matter what you do, always strive for improving your Net Promoter Score. That's the only way to reach the highest average industry scores. Have a look at 7 strategies to improve your Net Promoter Score.
Net Promoter Score Is a Relative Metric
Our final thought though would be to remember that a good NPS is sort of a relative metric.
While we’ve discussed a number of methods you can use to help formulate what a good score means for you, it's important not to lose sight of analyzing the feedback itself. You need to remember to value every single customer and make sure you respond to their feedback as individuals.
When you have a good NPS to start from, we’d recommend it’s best used as a self-improvement tool from there. Use it to zero in on your weaknesses and make sure you’re always keeping the customer experience at the top of your mind.
Net Promoter Score for the Win
Key findings of looking at average NPS is that industry average isn't as important as it is to collect customer data.
Let me repeat that one more time: Good NPS score is relative. There's no absolute NPS result you should aim for.
It's good to collect NPS data and survey customers in general, but be consistent with it. More importantly, know what is a good NPS score for your business.
Create a Feedback Loop
By regularly measuring your NPS, you can start to improve the overall customer experience.
This will lead to improved customer satisfaction and will help with reducing customer churn.
Become one of the industry leaders and start sending out NPS surveys regularly. Not just once a year.
Identify your happy customers, boost brand loyalty, and take actions to turn unhappy customers into advocates.
FAQ about Net Promoter Scores
What are common mistakes to avoid when using NPS?
Common mistakes include not following up with customers after they provide feedback, ignoring feedback from NPS detractors, and failing to analyze the underlying reasons for scores. Additionally, over-relying on NPS without considering other customer satisfaction metrics can lead to an incomplete understanding of customer sentiment.
One common mistake is not asking for a testimonial from an NPS promoter. That's a lost opportunity!
How often should I measure NPS?
The frequency of measuring NPS can vary depending on the business model, but it is generally recommended to survey customers at key touchpoints, such as after a purchase or service interaction, and periodically (e.g., quarterly or annually) to track changes over time.
Can NPS be used for internal benchmarking?
Yes, NPS can be used for internal benchmarking by comparing scores across different departments, teams, or periods within the same organization to identify areas for improvement.
What industries typically have high NPS scores?
Industries such as retail, hospitality, and consumer goods often have higher NPS scores due to the direct and frequent interactions they have with customers.