Net Promoter Score by Industry - NPS Industry Averages

Introduction to NPS by Industry
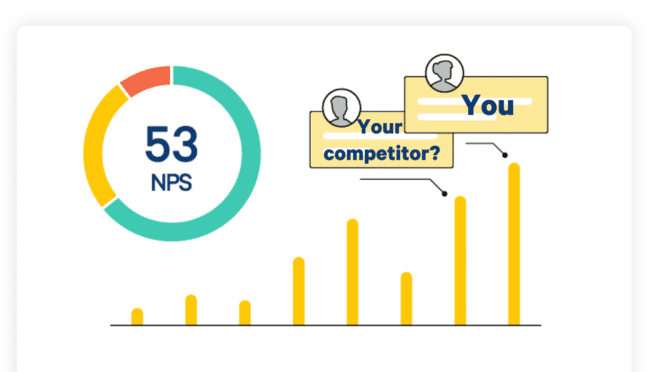
A good NPS is all relative.
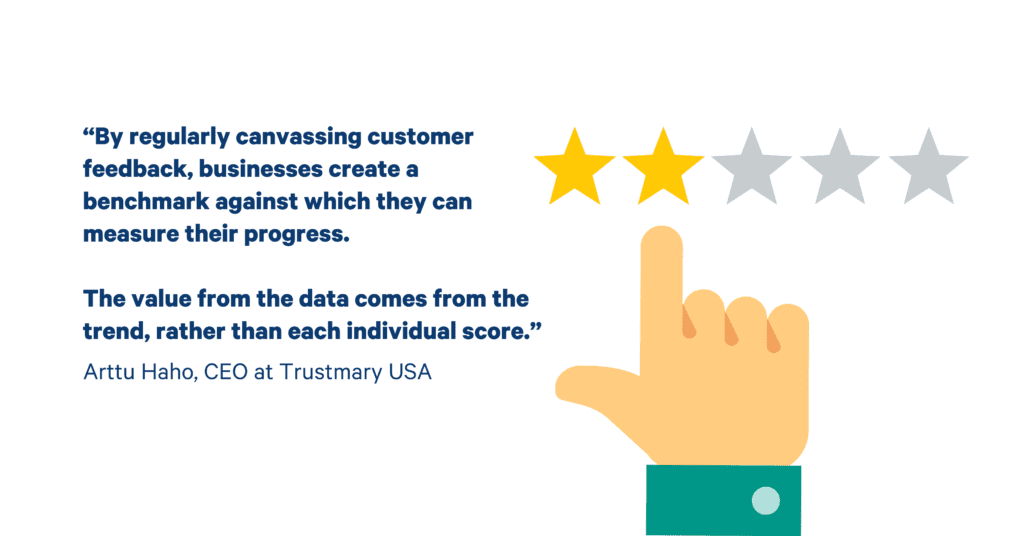
“By regularly canvassing customer feedback, businesses create a benchmark against which they can measure their progress,” according to Arttu Haho, Chief Growth Officer of Trustmary. “The value from the data comes from the trend, rather than each individual score.”
Comparing your NPS results to previous surveys can help you on the path to growth by identifying pain points in your customer experience, what your customers love about you, and referral and upsell opportunities.
But that’s not all.
Your Net Promoter Score benchmark compared against an industry standard helps you understand what good looks like for your business.
This article will explore why and how you can benchmark your NPS against the rest of your market.
We will look at the latest Net Promoter Score benchmarks within B2B and B2C sectors, and will provide helpful tips on what to do if your NPS doesn’t quite live up.
Curious about how your NPS stacks up against others?
What is Net Promoter Score (NPS)?
Let’s take a step back for a moment and explain what we mean by Net Promoter Score.
The Net Promoter System, designed by Fred Reichheld, Bain & Company, and Satmetrix Systems in 2003, measures customer loyalty.
NPS Survey
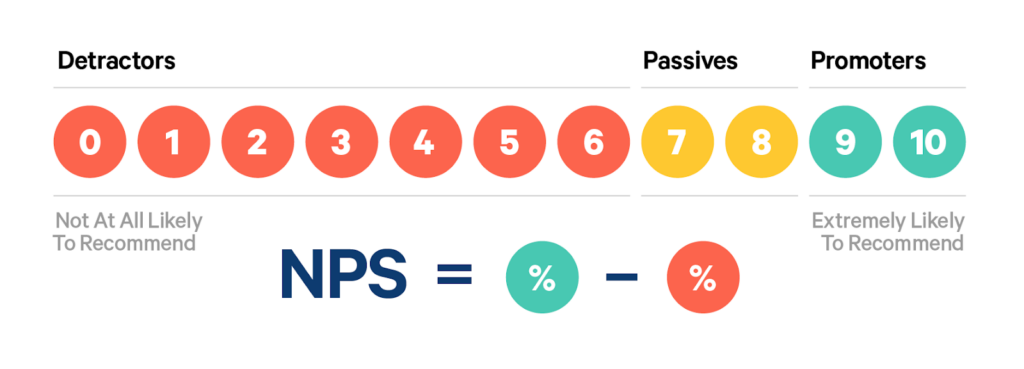
An NPS survey asks a rating question, ‘how likely are you to recommend our business, product or service to friends and family’, and customers rank their likelihood to advocate the company on an 11 point scale.
Responses can be sorted into three categories: NPS Promoters, Passives, and NPS Detractors.
The overall NPS score is calculated by subtracting the percentage of Detractors from the percentage of Promoters, and reported with a number between -100 and +100.
Net Promoter Score (NPS) is analyzed as follows:
- A good NPS score, generally speaking, is anything between 0 and 30.
- A score between 30 and 60, indicates that your clients love you.
- A score under 0 shows that you have more unhappy customers than satisfied ones, and that improvement is needed.
NPS is best used as a diagnostic tool in conjunction with an open-ended question to find out why customers feel the way they do, and other metrics to get a complete picture of customer experience and opportunities for growth.
Comparing your Net Promoter Score
There are two methodologies your can use to measure NPS against your industry.
- Absolute NPS compares your score to a loosely agreed-upon average of what a good score is, across all industries.
- Relative NPS compares your score to other companies in your industry.
Read our definitive guide to Net Promoter Score (NPS).
Why Look at Industry NPS Benchmarks
As a globally recognised system, NPS scores are widely measured and often published making data easy to compare with the rest of your market.
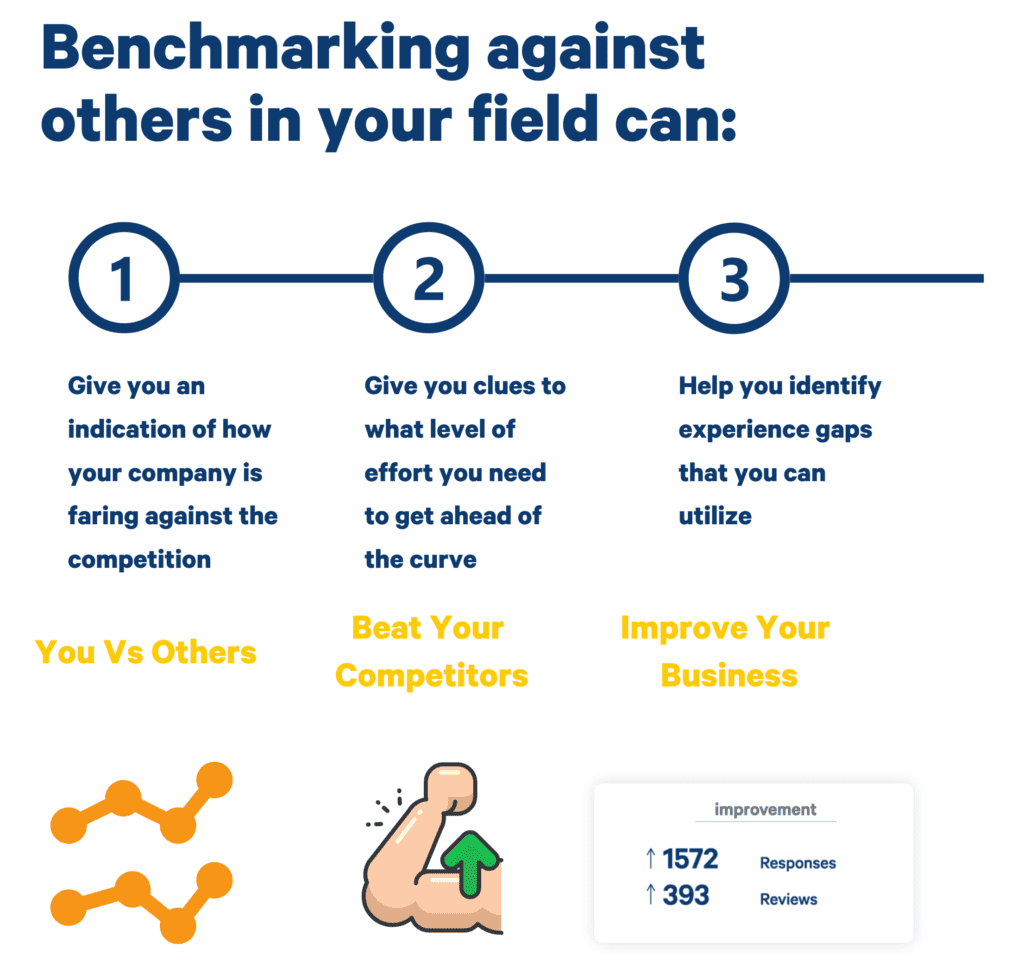
Benchmarking against others in your field can:
- Give you an indication of how your company is faring against the competition,
- Give you clues to what level of effort you need to get ahead of the curve,
- Help you identify experience gaps that you can utilize
Read more on NPS benchmarks
NPS by Industry
Average Net Promoter Scores are not all created equally across all industries.
The industry average provides a good baseline, while the leaders in your field give you a level of excellence to aim for.
Here’s how a relative NPS looks in different types of companies.
1. Different industries
A good net promoter score for one industry may not be good for another.
Companies operating in the consultancy sector, for example, enjoy a higher than average NPS, as a result of a longer, more personal sales model and on-going client nurturing.
The average NPS for dentists, on the other hand, may be lower due to the negative mind-set customers are in when dealing with them.
Take the time to understand the average scores for your industry NPS benchmark and why it is what it is. This will help you identify the actions you need to take to improve customer experience.
2. Famous Brands
It may be tempting to benchmark yourself against the top brands - after all, they’ve built customer loyalty, and many have high brand advocacy.
This chart shows the NPS data from 5 of the top brands.
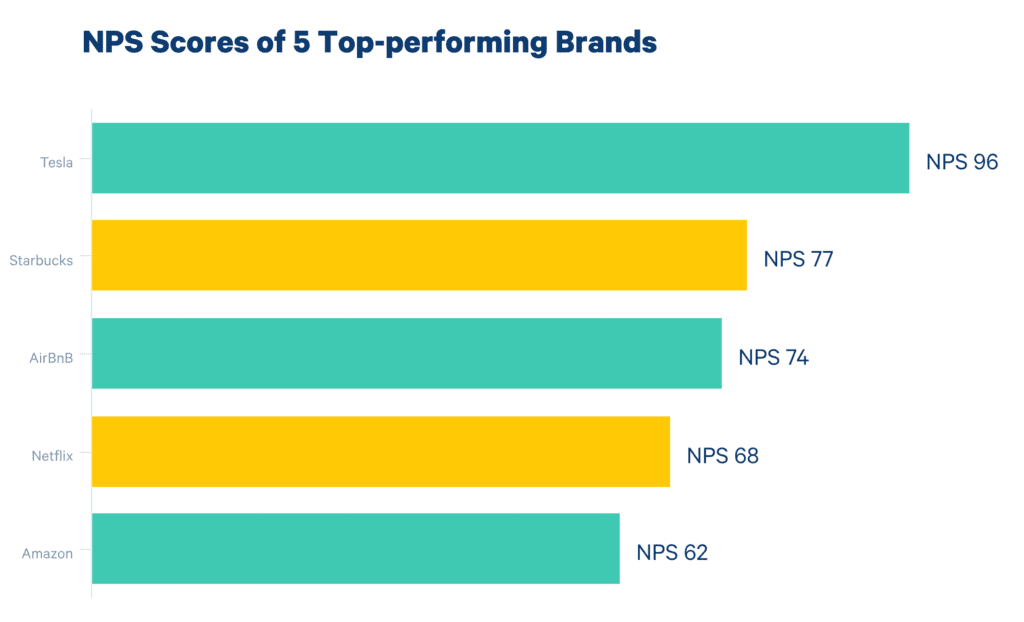
While it’s always good to aim high, it’s also important to remember to focus on your own NPS and your immediate competitors.
You might chase Tesla’s impressive score of 96, but then you risk falling foul of Goodhart’s law. Once your metric becomes a goal, it stops being a good measure.
It’s also worth noting that these companies may enjoy a high NPS because of other factors, a well-established company name or the niche market they operate in, rather than because of the customer journey.
3. SMEs
For smaller businesses, NPS is a cheap and relatively simple way to measure your progress against others in your market.
Conducting the research can be as simple as distributing an online questionnaire and doing your own calculation, or using tools such as Trustmary’s Pro feedback package that collects and calculates the results for you.

Sourcing the market average is easy to find too (check out our handy NPS benchmark guide below).
NPS benchmarks work particularly well for small businesses because it provides a fair measure of customer satisfaction against larger competitors.
Regardless of your advertising budgets or sales headcounts, happy customers are a great measure of customer loyalty.
Learn how you can start measuring NPS today, and collect reviews and testimonials with the same survey
Book your free demo with Trustmary.
4. B2C
Net promoter scores for B2C businesses provide valuable insight into customer satisfaction.
B2C businesses generally have a larger customer base and a faster sales process which lends itself to the simplistic nature of NPS surveys.
The results, when compared to others in the same industry, can predict industry leaders and up and coming competition over time.
2021 B2C Industry NPS Benchmarks

| Grocery | 33.3 |
| Retail | 32.9 |
| Streaming media | 32.2 |
| Investment Firm | 27.9 |
| Parcel delivery | 27.7 |
| Fast food | 26.6 |
| Social media | 25.3 |
| Wireless | 24.7 |
| Auto | 24.3 |
| Bank | 23.6 |
| Food delivery | 22.9 |
| Insurance | 21.9 |
| Software | 19.5 |
| Computer and tablet makers | 17.8 |
| Hotel | 17.2 |
| Health insurance | 16.1 |
| Utilities | 15.9 |
| Electronics | 14.4 |
| TV/ISP | 12.3 |
| Airlines | 11.9 |
| Car rental | 4.8 |
| Consumer Payments | -0.1 |
Source: Qualtrics XM Institute
5. B2B
Most of what you read about NPS online will refer to B2C companies, exploring ‘customer’ satisfaction instead of client or accounts.
That doesn’t mean NPS isn’t equally as valuable to B2B companies.
B2B companies tend to have smaller client bases, but the relationships tend to run deeper, resulting in higher customer satisfaction.
These closer relationships can translate to:
- Higher engagement with NPS surveys, and therefore a more accurate sample size,
- Higher satisfaction levels, resulting in more favorable NPS scores
- Better quality feedback and suggestions to open ended questions
2021 B2B Industry NPS Benchmarks
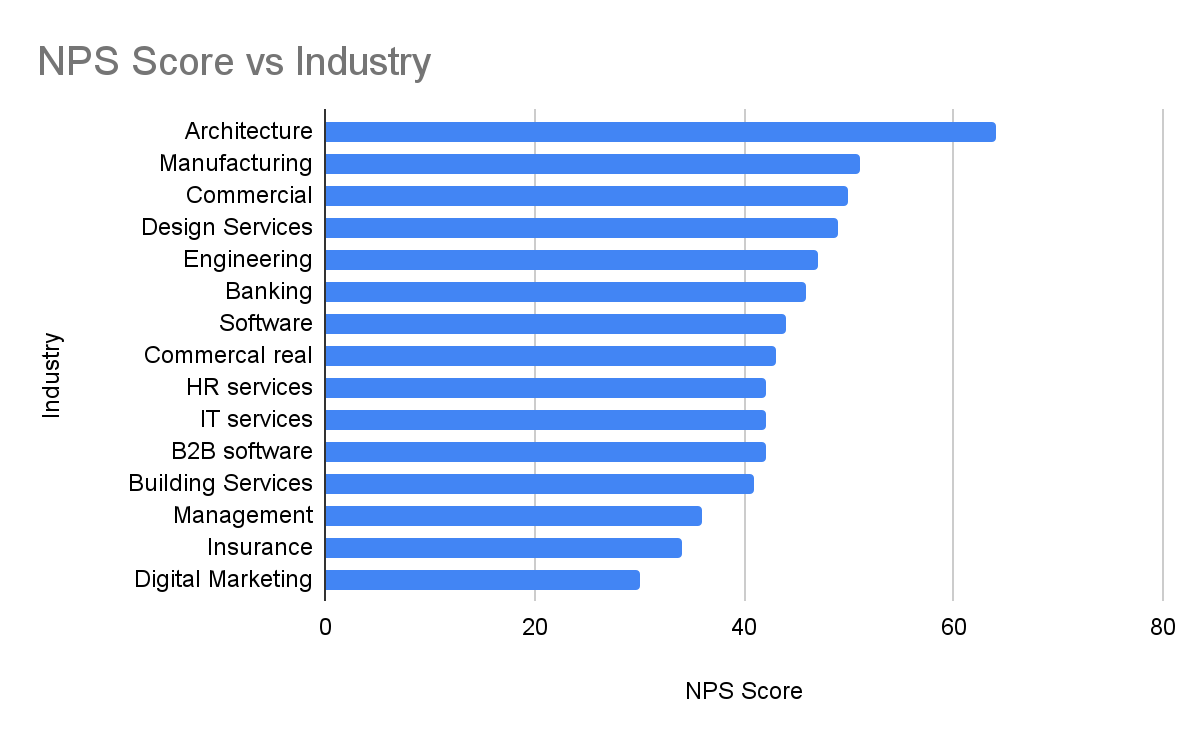
| Architecture | 64 |
| Manufacturing | 51 |
| Commercial Construction | 50 |
| Design Services | 49 |
| Engineering | 47 |
| Banking | 46 |
| Software development | 44 |
| Commercal real estate | 43 |
| HR services | 42 |
| IT services | 42 |
| B2B software | 42 |
| Building Services | 41 |
| Management Consutancy | 36 |
| Insurance | 34 |
| Digital Marketing Agency | 30 |
Source: Clearly Rated
Factors that Affect NPS Benchmarks
We’ve already covered why you should be comparing your NPS to others in your industry, but it’s worth noting that there a couple of factors that can affect NPS benchmarks:
1. Global events
Net Promoter Scores are impacted by economics, politics, and current events.
Let’s take a look back at some of the B2C industries that have the highest average NPS scores in 2021.
The impact of the global pandemic has driven demand for services such as groceries, streaming and parcel delivery across the board, resulting in higher levels of customer satisfaction.
On the other hand, car rentals, airlines and hotels are at the bottom end of the list. Infact, a study from Qualtrics reported a 15 point drop in the average NPS score across all industries, as a result of the pandemic.
Similarly, satisfaction withing financial services take a hit during times of recessions.
Take a look at your macro environment to see if it’s impacting your NPS.
2. Your competition
We mentioned Tesla earlier, who enjoy an NPS score of 96.
Tesla holds a unique position in a niche market with few competitors. Less choice means that they can set the standard for what the customer expects, leading to higher levels of satisfaction.
If we think about loyalty, unless you are truly delighting your customers, they will stay retained until something better comes along.
In markets with higher competition, companies that find their own unique value proposition will stay a step ahead.
Read more about customer loyalty.
3. Switching barriers
If there is a high cost of switching to a competitor, this may be reflected in the NPS.
On one hand, the high cost of switching could result in a higher NPS score, as customers form a bias to justify their initial decision.
This bias can be seen in the car industry, where changing cars is very expensive and so a customer may find themselves recommending the manufacturer, event if they aren’t 100% happy.
On the other hand, vendor barriers can cause lower NPS. For example, the cost (time and effort) to change utility companies can result in customers begrudgingly staying, but expressing their dissatisfaction.
4. Levels of tolerance
How forgiving are your customers?
Tolerance levels can impact your NPS score. The more tolerant your customers are, the more likely you are to receive a higher score.
For example, if you have a bad experience at a restaurant, not only are you unlikely to return but you’ll tell your friends and family not to go too.
If you have a bad experience with an accountant that you’re working with however, chances are that you’re more likely to work through it.
Fostering an emotional connection with your customers and creating outstanding customer experiences can help build up tolerance levels.
5. NPS Survey Bias
No survey is totally free from bias. The most typical types of survey bias are:
1.Sampling bias
All respondents should have an equal opportunity to receive an invite to answer your survey. In other words, use many distribution channels in order to avoid this bias.
2. Nonresponse bias
Analyze which types of groups don't respond at all and aim to reach them better in the future. If a significant customer segment never replies, this will skew your overall NPS data.
3. Response bias
Make sure you don't asked biased questions. Word your questions in a neutral manner and don't lead the respondents to answer in a certain way.
For example, "How awesome was our customer service on a scale of 0 to 10?" implies that the customer service was "awesome" in the first place. The NPS question "How likely are you to recommend us to a friend or a colleague" is an unbiased question.
4. Order bias
Think about the order in which you ask your questions! It's a good idea to ask any demographic questions only at the end of the survey. Furthermore, if you have different topics within the survey, group them together.
As an example, if you ask NPS and open feedback for both service and for the whole process, first ask NPS and open feedback on service and then NPS and open feedback on the whole process. A horrible way to do this would be to ask both NPS first and then the open feedback for both.
What to Do if Your NPS Falls Short?
Benchmarking your NPS against the industry average can be a great way to measure your overall customer satisfaction in comparison to the competition.
But what happens if your number falls short?
Here are 5 tips on how you can improve your NPS:
1. Use the data
Net Promoter Score is literally the voice of the customer.
Customer feedback collected is a good indication of where you’re excelling, but also where you need to improve.
Analyze your customer data to drill down into exactly who your Promoters and Detractors are, and why they scored you the way that they did.
Alongside other metrics, it can help spot opportunities for growth, and even help predict customer churn.
This information can then be used to guide strategy across the business.
2. Turn Your Focus to Customer Success
A study by Gartner found that 80% of businesses expect to compete solely on the basis of customer experience.
Customer-centricity within each department within your business can help to bridge the gap in customer experience and improve the customer journey.
“When everyone in the company has a single goal, to serve your customers better, improvements to NPS will happen on their own,” says Arttu Haho, Chief Growth Officer of Trustmary.
A good example of a company that does this is Slack. The messaging app incorporated customer feedback into its strategy from day one.

3. Close the loop with your detractors
You’ve done the research, you’ve used the data, you’ve made the changes. Now tell your Detractors the good news.
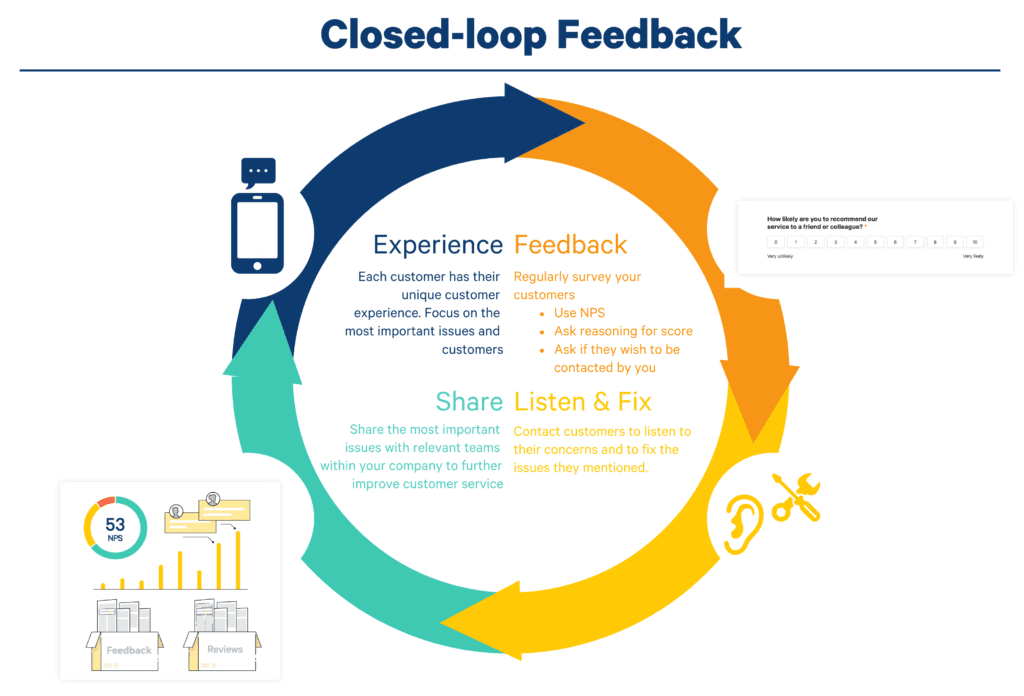
These unhappy customers are unhappy for a reason, but sharing the improvements you’ve made as a result of their negative scores can help them feel valued and heard.
When you track NPS regularly, you'll be able to turn your unhappy customers into promoters!
4. Utilize your Promoters
Your Promoters are your die hard fans. You’ve already built brand loyalty with them so make sure you are using it to share positive word of mouth.
A few ways that you can make the most of your Promoters are:
- Build a customer loyalty program to reward their advocacy
- Create video testimonials that can be used across your marketing channels
- Make it easy for them to recommend your business
- Understand what they love and see how this can be used across your customer base
- Marketing can share NPS across channels
5. Learn from Your Competitors
Your NPS benchmark doesn’t have to stop at comparing the average NPS scores for your industry.
Take a look at the market leaders and analyze what they are doing to drive customer success.
At the same time, understand what their Detractors have to say - perhaps you can address a gap in their experience to drive your own growth?
Conduct the same exercise with the laggards too.
By understanding what works and what doesn’t across your industry, you can set realistic goals for your own company.
Integrate Feedback Collection to Business Processes
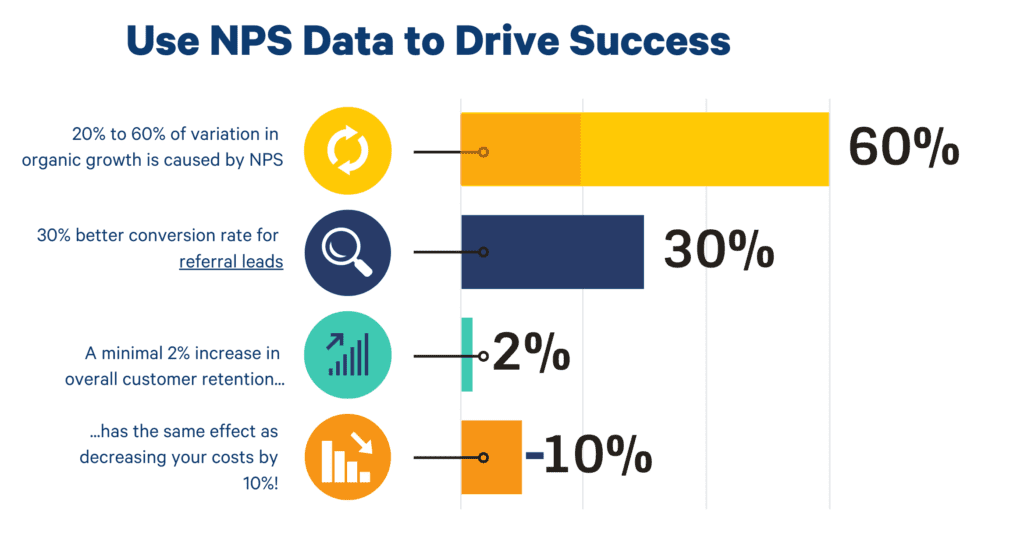
The value from NPS comes from the comparison, whether this is against your previous data or against your competitors.
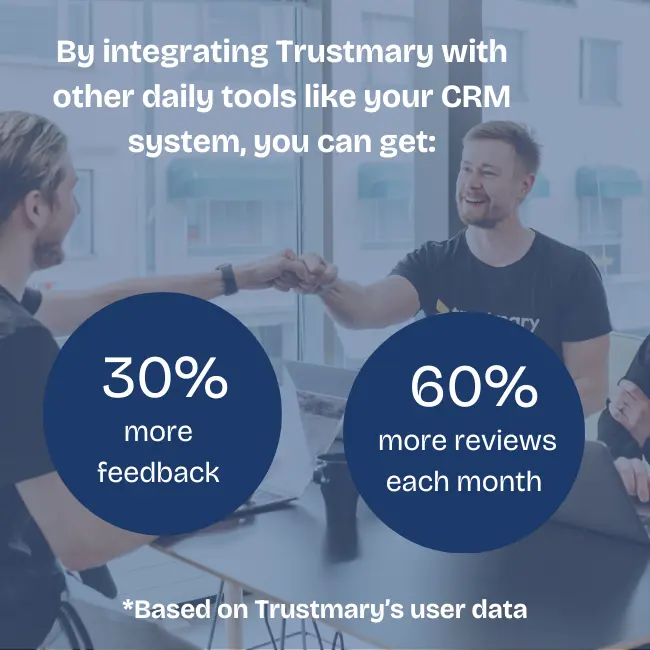
However, to get accurate NPS data, you need to constantly measure it. Our research showed that integrating NPS surveys into your existing processes yields a 67% higher number of responses than if companies didn't automate sending NPS surveys.
Benchmarking against others in your industry allows you to understand how satisfied your customers are with your brand, in relation to the rest of the market. If your score is lower than the average NPS, you risk losing business to the competition.
At the same time, comparing your NPS score against the leaders in your market sets the bar for you to aim for.
Plus, further analysis can help you identify underserved areas where you can make a difference in the experience that you provide.
Learning how to present NPS results internally can help you get buy-in from coworkers to focus more on the matter.
But be careful not to lose sight of why you are comparing your NPS: to measure loyalty and give your customers the best possible experience.
You can deep dive into customer experience and how to improve customer experience, or start measuring NPS straight away by booking a meeting with us.
Additional Resources
- Definitive guide to NPS
- Explore other Net Promoter Score benchmarks
- Find out how to improve your NPS
- Check out how to improve customer experience
- Get inspired by NPS question examples
FAQs
Why should I use the Net Promoter Score System?
NPS is a great metric for measuring customer loyalty, because:
- It’s simple to measure. Especially if you use the best NPS Software!
- It’s easy to benchmark against your own performance and that of others in your industry.
- It produces a number you can use to track your customer experience.
- It can be used alongside other measures to paint a complete picture of how your business is performing.
What can I benchmark my score against?
You can use your Net Promoter Score to benchmark against:
- Companies in your field,
- Different segments within your business,
- Previous NPS data.
Why should I compare my score against the average Net Promoter Score in my industry?
Benchmarking your NPS against others in your field can:
- Give you an indication of how your business is faring against the competition,
- Give you clues to what level of effort you need to get ahead of the curve,
- Help you identify experience gaps that you can use to your advantage.
How can I benchmark my NPS?
There are two methods of benchmarketing your NPS score.
- The absolute method takes a compares your score to a loosely agreed-upon average of what a good score is, across all industries.
- The relative NPS method looks at your score in comparison with others in your industry.
What factors impact my NPS score?
There are a number of factors that affect NPS benchmarks that you should be aware of:
- Global events
- Your competition
- Vendor switching barriers
- Customer tolerance
What if my NPS is low compared to others in my industry?
Benchmarking your NPS allows to you to see how you perform against your competitor but should not become the goal itself.
However, there are steps that you can take to improve your customer experience, and your NPS as a result:
- Utilize the data you’ve collected
- Turn your focus to customer success
- Close the loop with your Detractors
- Make the most out of your Promoters
- Learn from your competitors