Alternatives to NPS - Net Promoter Score


‘The Only Number You Need to Grow.’
When Net Promoter Score (NPS) was introduced to the world in 2003 by Fred Reichheld of Bain & Company, in collaboration with Satmetrix Systems, it was quickly hailed as the one metric every company needed when measuring customer loyalty.
But it wasn’t long before criticisms of the NPS methodology began to emerge.
Pretty soon it became apparent that NPS is best used as a diagnostic tool alongside alternative metrics to get a complete picture of customer experience and opportunities for growth.
This article explores the pros and cons of using NPS, the best alternatives to Net Promoter Score (NPS) and how you can calculate each metric.
Quick Facts on Net Promoter Score (NPS)
- An NPS survey asks customers a simple question:
- How likely are you to recommend the business, product or service to a friend or colleague?
- Scores are ranked on an 11 point scale.
- Survey responses can be sorted into three categories; NPS Promoters, Passives, Detractors.
- The NPS score is calculated by subtracting the percentage of Detractors from the percentage of Promoters, resulting in a number between -100 and +100.
Generally speaking, anything above 0 means your business has more satisfied customers than unhappy ones.
Find out everything you need to know about NPS in our definitive guide to NPS.
Try Trustmary Method to get the following benefits with one short survey:
- Measure customer satisfaction and loyalty (NPS, CSAT or star rating) of a segment or whole customer base
- Get open feedback
- Turn open feedback into reviews
Okay, I'll go over some reasons why you should consider using NPS surveys.
Only after that will I show the NPS alternatives.
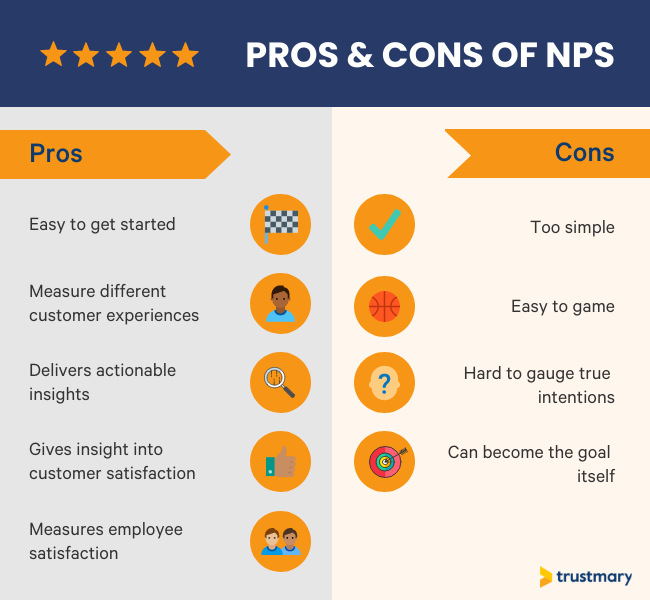
5 Reasons Why You Should Be Using NPS
For many companies, NPS score provides valuable insight into satisfied customers and the success of their overall customer experience activities.
Here are 5 reasons why:
It’s Simple to Get Started
Surveys consist of the NPS question that asks customers to rank their likelihood to recommend your business or product.
The follow-up questions explore why they gave that score.
That requires some typing from the customers, but open feedback will give you deeper insights than the number.
The ease of the survey means that you can go as simple as a questionnaire, which is distributed to your customer base via email.
The easiest way to start means choosing the best NPS tool to help you create professional surveys.
If you choose the right software, other tools aren't needed for:
- Give existing customers a great survey experience
- Sending the survey across various channels
- Analyze the customer data and responses
- Report the results in real-time to relevant stakeholders
Check out our guide to NPS Software.
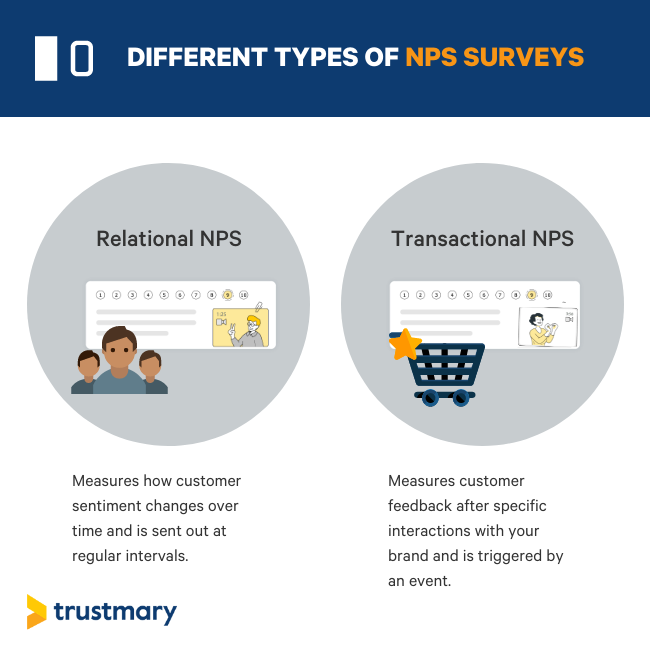
NPS Can Measure Different Customer Experiences
NPS can be used to measure customer experience in different ways.
- Relational Net Promoter Score measures how customer sentiment changes over time and is sent out at regular intervals.
- Transactional Net Promoter Score measures customer feedback after specific interactions with your brand and is triggered by an event.
NPS Scale Delivers Actionable Insights
Once you have the data from your survey, there are some immediate actions you can take.
Responses from Detractors can be analyzed to see if there are immediate fixes that can be made to your product or service. You could even invite them to take part in a more detailed feedback session.
These are key steps in improving the overall health score of your customer base, and to improve customer satisfaction and loyalty both short term and long term.
Customer feedback from your Promoters can be utilized as reviews and testimonials for your marketing activity. After all, they love your product and can provide valuable social proof.
Find out more about how social proof can help your business.
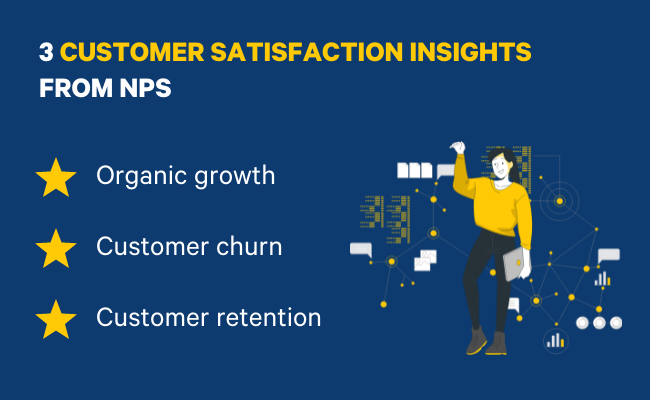
Holictic View into Customer Satisfaction
The data that you get from NPS provides guidance on the key indicators of customer satisfaction - organic growth, churn rate, and customer retention.
Every SaaS business relies heavily on knowing what their customers think and want.
Here are a few things various industries can learn from SaaS business' learnings.
SaaS Businesses Know That...
- High numbers of Detractors, for example, indicate that your churn rate may be set to increase.
- A steady increase in your number of Promoters indicates that retention may also be high, and that your customer base may respond well to something like upselling opportunities.
NPS is an easy way to benchmark your business against the competition.
It Can Measure Employee Satisfaction
Employee NPS surveys are also straightforward to conduct and give you valuable insight into the sentiment of your workforce.
Start measuring your NPS today with Trustmary. Sign up for a free trial
4 Criticisms of NPS
Even with its widespread popularity, NPS isn’t without its drawbacks. Let’s explore some of it’s criticisms.
It’s Too Simple
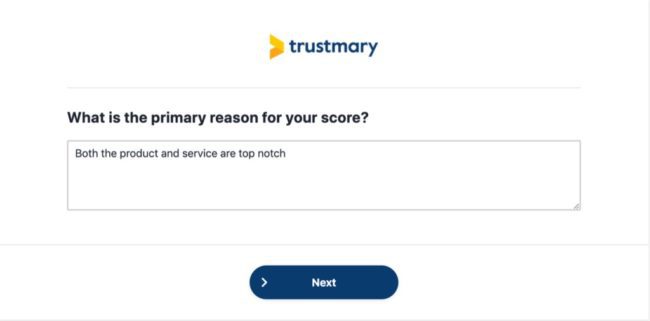
NPS can help you identify happy customers but alone, it provides very little information about what to do next.
On its own, the NPS score misses critical feedback.
A follow-up qualitative question that asks respondents to explain why they’ve given that particular feedback, like the one below, is often needed to get any real insight.
It’s Easy to Game
Khadeeja Safdar and Inti Pacheco explored the shortcomings of NPS in the Wall Street Journal, and found that “the results are easy to manipulate, whether intentionally or unintentionally”, by only asking happy customers for feedback, for example.
Similarly, Robert East et al. (2011) pointed out that most negative comments about a brand came from former customers or never customers, and so only sampling current customers paints an inaccurate picture of negative word of mouth.
The ability to skew results, intentionally or otherwise, means that NPS can be a biased measure of customer experience on its own.
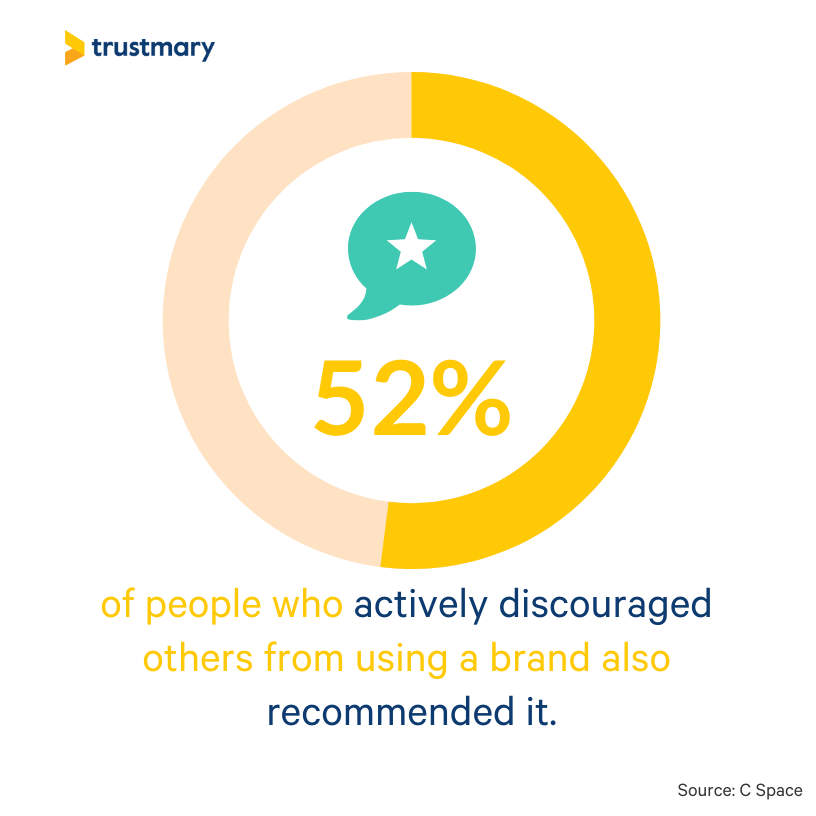
It’s Hard to Gauge True Intentions
A study from V. Kumar, et al (2007) showed that only about half of those who intended to recommend specific businesses actually did so.
C Space researched customer intention and found that 52% of all people who actively discouraged others from using a brand had also actively recommended it.
Respondents may say one thing, but their actions show another, making it difficult to use NPS as a single measure of loyalty.
It Can Easily Become the Goal Itself
Goodhart’s Law, “when a measure becomes a target, it ceases to be a good measure”, isn’t about NPS specifically but it certainly is appropriate.
NPS is a widely used metric for customer experience, but moving the needle on your Promoters can easily become the goal, rather than improving the customer journey.
“If your business is only focused on increasing Promoters, you’re missing valuable feedback from your Detractors,” said Arttu Haho, CEO of Trustmary US.
Alternatives to Net Promoter Score
Whether you’re looking for different measurements to combine with NPS, or an alternative customer satisfaction measure altogether, there is more than one way to get feedback on your business, products and services.
Here are 6 NPS alternatives, explained:
NPS variations
Let’s get one thing straight.
Despite its criticisms, NPS is still a valuable metric.
It may be that you consider making some adjustments so that it works better for your business purposes.
Creating your own NPS survey, through adjusting the scale to 0-5 or by rewording the initial survey question, allows you to tailor the customer survey to suit your priorities.
However, a downside to this method is that you lose the ability to benchmark your figure with previous surveys conducted using the traditional method, or with other companies.
Find out how to benchmark your NPS.
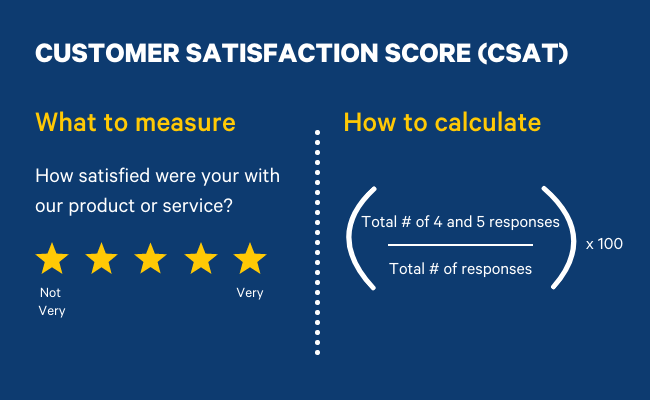
Customer Satisfaction Score (CSAT)
With a focus on customer satisfaction, the CSAT score centers around a single survey question:
“How satisfied were you with our service/product?”
Customers rank their level of satisfaction, usually on a scale from 1-5.
(Total number of 4 and 5 responses) ÷ (Total number of responses) x 100
Like NPS surveys, CSAT is easy to calculate and can be used to gauge satisfaction at different stages of the customer journey.
The question is straight to the point and leaves no room for interpretation, eliminating that intention vs action bias that we mentioned before.
However, CSAT surveys only explore satisfaction at that point in time and don’t encompass customer loyalty.
Try a CSAT software to automate the feedback process.
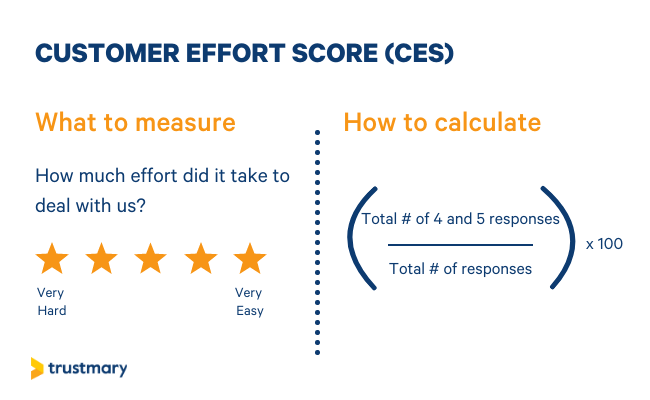
Customer Effort Score (CES)
The customer effort score CES ranks ease of use, a key factor to customer satisfaction, with a simple question:
“How much effort did it take to deal with us?”
Respondents rank the level of effort on a 1-5 scale.
(Total number of 4 and 5 responses) ÷ (Total number of responses) x 100
CES is easy to conduct and requires a straightforward calculation.
It’s data can give businesses understanding behind feature adoption, potential problems to be addressed, and reasons for churn.
‘How much effort’, however, is quite a subjective term as people have different abilities and different levels of tolerance. Something that one person finds easy, could be difficult for another.
Also, like NPS and CSAT, CES survey questions should be supported with qualitative questions to get to the bottom of ‘why’ customers may feel a certain way.
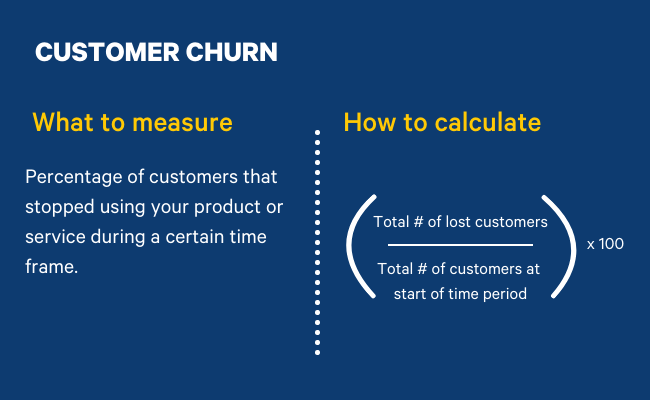
Customer Churn
Customer churn is the percentage of customers that stopped using your product or service during a certain time frame.
While you may want all of your customers to stay with you once they’ve been acquired, a 100% retention rate is unrealistic.
(Lost Customers ÷ Total Customers at the Start of Time Period) x 100
The lower the number, the better your customer retention is.
However, customers can leave for different reasons that are sometimes unrelated to how satisfied they are with your product.
For example, a Design team may love the design program that they use, but budget cuts mean that they have to look for a cheaper alternative.
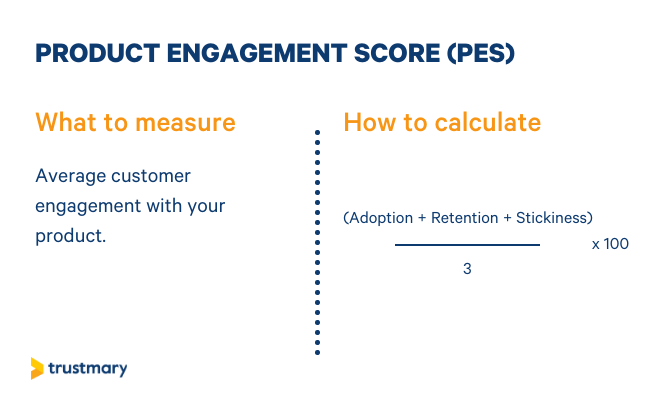
Product Engagement score (PES)
Product engagement score (PES) measures how engaged your customers are with your product, with a view that higher engagement means higher satisfaction levels.
Unlike some of the other NPS alternatives that rely on customer surveys to gain insight into satisfaction, PES is calculated by finding the average of stickiness (DAU/MAU), feature adoption, and retention.
(Adoption + Retention + Stickiness) ÷ 3 x 100
The combination of these indicators provides a single score for engagement that you can use to predict future actions, such as renewals, upgrades, and even reduce churn.
The single score is easy to track over time, giving you an evolving picture of how your product is performing.
Also, removing the survey element means that you remove the subjectivity that comes with understanding the question, or any unintended bias that may come from the survey process.
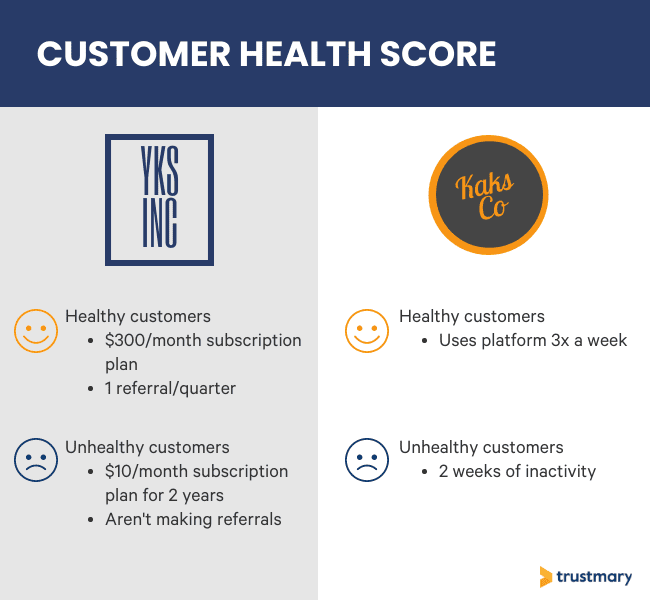
Customer Health Score
Customer health score categorizes happy customers as healthy, and those who are struggling as unhealthy.
The key here is spotting the unhealthy ones and bringing them back on track before they can churn.
Customer health scores are bespoke to each business and so the factors that are measured vary from company to company.
While this gives you full control over what is important to you and how you weigh each variable, it does mean that customer health scores are internal metrics that can’t be benchmarked across industries.
For example, YKS Inc and Kaks Co are accountancy software companies
YKS say a healthy customer is on the $300/month subscription plan and makes at least 1 referral per quarter. An unhealthy customer is anyone who has been on the $10/month plan for more than two years, and who aren’t making any referrals.
Kaks Co may decide that a healthy customer is simply one that uses the platform 3 times a week, and an unhealthy customer is one that has 2 weeks of inactivity.
Neither company is wrong, but chances are these two different customer health score measures will paint two very different pictures of satisfaction.
NPS – Straightforward Question Gets Results
NPS is a firm favorite of businesses measuring customer loyalty, but it doesn’t come without its downsides.
Even with the most stringent research methodology, it still works best alongside other metrics to create a comprehensive picture of customer satisfaction.
The biggest hurdle is identifying different touchpoints where you should measure customer satisfaction.
Once that is determined, can you decide the most essential metric you want to measure at that point.
We explored several different alternatives, some of which require a customer survey, others can be calculated with figures that most businesses have to hand.
But choosing the right customer satisfaction measure is ultimately down to your objectives from gathering customers feedback, and your specific business needs.
Try out different ways to measure customer satisfaction with a Trustmary free trial.
Further Reading
What is NPS Software and How to Maximize its Benefits
Actionable Guide to Measuring and Analyzing Customer Satisfaction
FAQ about Alternatives to NPS
Why should I be considering an NPS alternative?
NPS surveys give valuable insight into customer loyalty to companies worldwide, but even so, it works best in conjunction with other metrics to paint a complete picture of customer satisfaction.
What are the alternatives to NPS?
The main alternatives customer satisfaction measures are:
- Customer Satisfaction Score (CSAT)
- Customer Effort Score (CES)
- Customer Churn
- Product Effort Score (PES)
- Customer Health Score
How do I calculate my Customer Satisfaction Score (CSAT)?
CSAT asks customers to rank how satisfied they were with a product or service on a 0-5 scale. The score is calculated by:
(Total number of 4 and 5 responses) ÷ (Total number of responses) x 100
How do I calculate my Customer Effort Score (CES)?
CES asks, “how much effort did it take to deal with us?” Respondents rank the level of effort on a 1-5 scale. The score is calculated by:
(Total number of 4 and 5 responses) ÷ (Total number of responses) x 100
How do I calculate Customer Churn?
Customer churn is calculated by:
(Lost Customers ÷ Total Customers at the Start of Time Period) x 100.
How do I calculate my Product Engagement Score (PES)?
PES is calculated by:
(Adoption + Retention + Stickiness) ÷ 3 x 100
How do I work out my Customer Health?
The methodology for calculating customer health varies from company to company in line with the business’s specific needs.