Survey Data Analysis Made Easy

Understanding your customers is key to growing your business. One of the most effective ways to gain insights into customer preferences, behaviors, and satisfaction levels is through survey data.
However, collecting data is only half the battle; analyzing it correctly is crucial for making informed decisions. In this guide, we'll explore how to analyze survey data to get a clearer picture of your customers.
Example of Customer Feedback Dataset
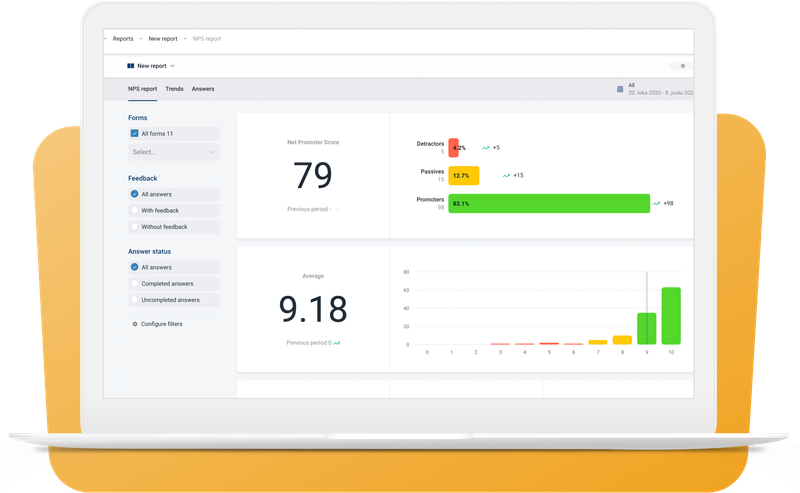
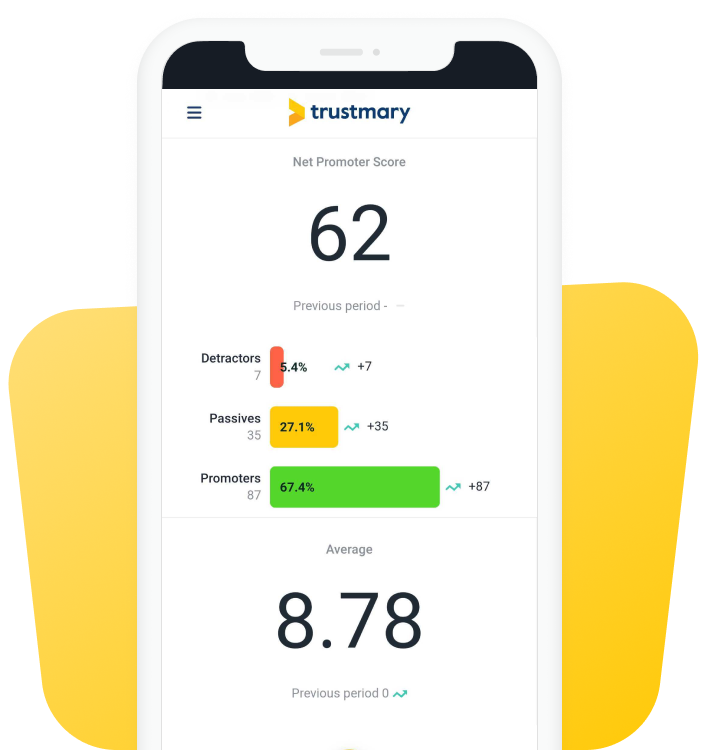
One effective way to analyze your company's success is by collecting and comparing Net Promoter Score (NPS) data over time.
NPS measures customer loyalty and satisfaction by asking respondents how likely they are to recommend your company to others on a scale of 0 to 10.
How to Use NPS Data:
- Collect NPS Scores: Send out an NPS survey and gather responses.
- Segment Your Data: Divide respondents into Promoters (9-10), NPS Passives (7-8), and Detractors (0-6).
- Calculate the NPS: Subtract the percentage of Detractors from the percentage of Promoters.
- Compare Over Time: Conduct the NPS survey periodically (e.g., quarterly) and compare the scores to track changes in customer loyalty.
Example:
If your NPS was 40 in Q1 and increased to 50 in Q2, this indicates an improvement in customer satisfaction and loyalty.
By analyzing the reasons behind these changes, you can identify successful strategies and areas that need attention.
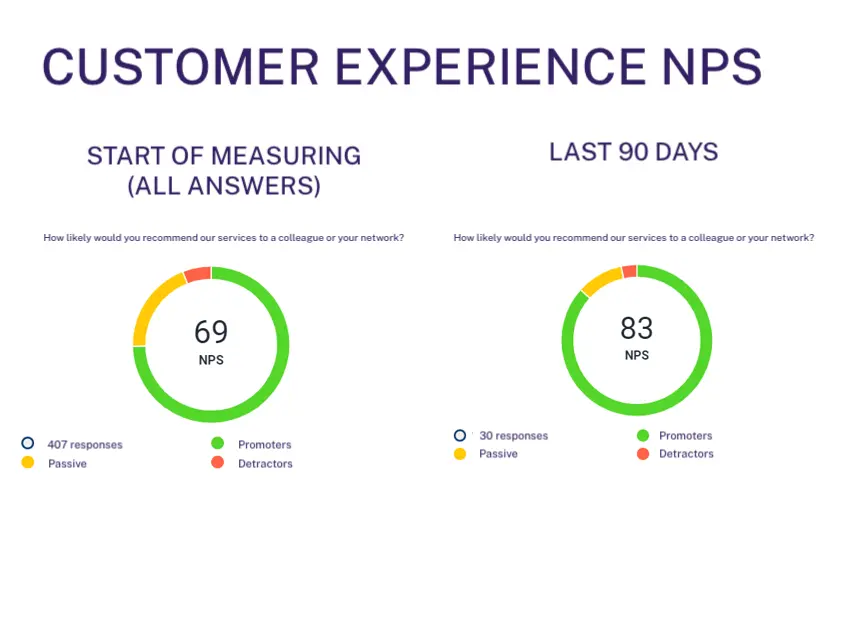
NPS Grew from 46 to 70
Eezy Personnel did just that and was able to improve its customer experience over time, when it focused on measuring and analyzing NPS with Trustmary.
10 Steps to Survey Data Analysis
- Set Clear Objectives
- Organize and Clean Your Data
- Categorize the Data
- Use Descriptive Statistics
- Employ Cross-Tabulation
- Analyze Open-Ended Responses
- Identify Trends Over Time
- Segment Your Data
- Visualize Your Data
- Take Action Based on Insights
1. Set Clear Objectives
Before diving into the data, define what you want to achieve. Are you looking to improve customer satisfaction, understand buying behaviors, or gauge interest in a new product?
Clear objectives will help you focus your analysis on the most relevant data points.
2. Organize and Clean Your Data
Start by organizing your survey data in a spreadsheet or a survey analysis tool.
Clean the data by removing any incomplete or irrelevant responses. This step ensures that your analysis is based on accurate and reliable information.
3. Categorize the Data
Group your survey questions into categories that align with your objectives. For example, if you’re analyzing customer satisfaction, categorize questions related to service, product quality, and overall experience.
This helps in structuring the analysis and making it more manageable.
4. Use Descriptive Statistics
Descriptive statistics like mean, median, mode, and standard deviation provide a basic understanding of the data.
For instance, if you asked customers to rate their satisfaction on a scale of 1 to 10, calculating the average score can give you a quick overview of customer satisfaction levels.
Example:
If the average satisfaction score is 8.5, it indicates a generally positive customer sentiment.
5. Employ Cross-Tabulation
Cross-tabulation is a method used to examine the relationship between two or more variables.
This technique is particularly useful for understanding how different customer segments (age, location, purchase frequency) respond to survey questions.
Example:
Cross-tabulating satisfaction levels with purchase frequency might reveal that frequent buyers are more satisfied than occasional buyers. This insight can guide your loyalty programs and marketing strategies.
6. Analyze Open-Ended Responses
While quantitative data provides clear metrics, qualitative data from open-ended questions can offer deeper insights.
Use text analysis tools to identify common themes, sentiments, and keywords in customer comments.
If multiple customers mention long wait times in their comments, it indicates a specific area for improvement.
7. Identify Trends Over Time
Analyzing survey data over different periods can help identify trends and patterns.
Comparing current data with past surveys can show whether your strategies are improving customer satisfaction or if there are emerging issues that need attention.
Example:
If customer satisfaction has increased by 10% compared to the previous year, it suggests that recent changes are positively impacting your customers.

8. Segment Your Data
Segmenting your survey data by different demographics or customer behaviors allows for a more detailed analysis. This can help tailor your strategies to specific groups.
You might find that younger customers prefer online support, while older customers favor phone support. This information can guide your resource allocation for customer service.
If your survey tool itself doesn't include good enough segmentation features, you can use Google Sheets for data analysis and visualization.
9. Visualize Your Data
Use charts, graphs, and dashboards to visualize your survey data. Visual representations make it easier to spot trends, patterns, and outliers, and they are also more effective in communicating findings to stakeholders.
A bar chart comparing satisfaction levels across different age groups can quickly show which age group is the most satisfied.
10. Take Action Based on Insights
Finally, the goal of analyzing survey data is to take actionable steps to improve your business. Use the insights gained to inform decision-making, refine strategies, and implement changes that enhance customer experience.
Example:
If the analysis shows that customers are dissatisfied with shipping times, you might consider partnering with a faster delivery service or improving your logistics process.
Importance of Survey Data
Analyzing survey data is essential for understanding your customers and making informed business decisions.
However, this process can be time-consuming and complex.
Trustmary provides ready-to-use reports, allowing you to start looking at the results immediately without the hassle of segmenting data manually.
Moreover, you can share your findings with stakeholders through a password-protected link, providing live results instead of having to download and send PDF files.
This streamlined approach not only saves time but also ensures that everyone has access to the most up-to-date information.
Looking to Collect Survey Data?
Setting up Trustmary to start collecting survey data is a breeze. Trustmary’s platform simplifies the entire process, from creating your survey to distributing it to your audience and analyzing the results. Here’s how you can get started:
- Create Your Survey: Use Trustmary's intuitive survey builder to create customer satisfaction surveys from templates, but tailored to your needs. You can choose from a variety of question types and templates.
- Distribute Easily: Share your survey via email, social media, or embed surveys on your website. Trustmary makes it easy to reach your target audience.
- Collect Responses: Gather responses in real-time and monitor participation through Trustmary’s dashboard.
- Analyze Effortlessly: Once responses are collected, Trustmary automatically organizes the data, providing you with instant insights and ready-to-use reports.
- Share Findings: Share your results with stakeholders through a password-protected link, giving them live access to the most current data without the need for manual updates.
FAQs
How do I start analyzing survey data?
Begin by setting clear objectives, organizing and cleaning your data, and then using descriptive statistics and cross-tabulation to find patterns and insights.
What tools can I use for survey data analysis?
Common tools include Excel, Google Sheets, SPSS, Tableau, and specialized survey analysis software like Qualtrics and SurveyMonkey.
How often should I analyze survey data?
Regular analysis is recommended, such as quarterly or bi-annually, to keep track of trends and address issues promptly.
What should I do with open-ended responses?
Use text analysis tools to identify common themes and sentiments, which can provide deeper insights into customer opinions and areas for improvement.
Why is data visualization important?
Visualizing data helps in easily identifying trends, patterns, and outliers, making it easier to communicate findings and make informed decisions.