NPS benchmarks from Nordics

NPS is quite a commonly used meter and has been slowly gaining ground around the world. There are many opinions about the usefulness of the metric and as a single figure it does not yet give a very comprehensive picture of anything.
However, in many cases it is quite effective as a benchmark and also quite comparable between companies.
We have conducted customer experience research for over 160 companies in Nordic countries and as part of these surveys we have also measured NPS. (Looking to measure your NPS? Try the free version of our NPS tool!)
For the first time, we are putting together the results of these studies.
Read also: 35+ Word of Mouth Marketing Statistics
NPS Benchmarks from Nordic countries
Our entire sample averaged 48,834 for NPS. Among the companies surveyed, the highest measured NPS was 95 and the lowest NPS was -47.
Of course, it is good to note that, by default, research is only conducted for companies that are interested in researching and developing their own customer experience. So the results are not completely generalizable.
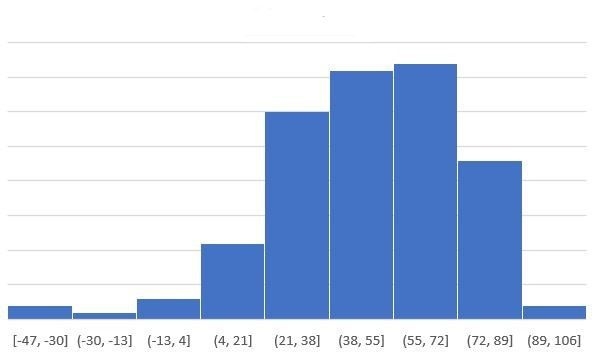
Below is a breakdown of the different NPS-scores we measured:

As you can see from the graph, most of the measured results are between 21 and 89, but there are also figures outside that.
Most likely lower-than-average NPS numbers are under-represented in the sample and above-average NPS numbers are over-represented.
What does NPS look like for companies in different industries in nordics?
Of course, we don't have data in all industries, but here's what we have:
- The NPS average for industrial companies is 62.43
- The average NPS for travel companies is 61.57
- The average NPS for marketing companies is 59.33
- Average for NPS for furniture companies: NPS 58.8
- Average of repair companies NPS: NPS 49
- Financial service companies' average NPS: 47.6
- Average for construction industry NPS: 46
- IT companies average NPS: 38.79
- Energy companies' average NPS: 25.43
As you can see from the figures, the average performance in NPS is very different in different fields. Comparing NPS across sectors is therefore reasonably challenging.
In conclusion about benchmarking NPS in nordics
As the most important take away from the data, it could be said that NPS should be benchmarked between companies inside one industry. As NPS scores differ greatly between different industries.
For example, for a marketing company, NPS of 55 is good, but not exceptional (at least not based on our sample). On the other hand, for an IT company, NPS of 55 may already be exceptionally good.
Read more about NPS benchmarks and 2024.
Have you thought about measuring your eNPS? Find the best NPS tool to match your needs.