Customer Loyalty Indicators Every Business Needs to Track


A single click can give customers numerous options. So how do you nudge your target market’s behavior in your favor?
Acquiring new customers with methodical marketing is a common practice. But to sustain your brand, you need to retain your customers.
That is where brand loyalty comes in. Loyal customers have an emotional bond with their preferred brands. They trust you and are more likely to maintain business with you. Hence, they are usually the ones to buy high-margin products and services.
Customer loyalty is the key to thriving in marketing and sales. But for that, you need to constantly improve to maintain loyalty — which requires frequent monitoring of different customer loyalty indicators.
In today’s article, we will see the top metrics to see how successful your campaigns are at boosting customer loyalty.
6 Best Indicators Of A Successful Loyalty-Boosting Campaign
Here's the list of six most important customer loyalty indicators you should be following and improving.
1. Higher Customer Lifetime Value
The customer lifetime value (CLV) can show how effectively your campaigns boost customer loyalty. It paints an accurate picture of your business’s future and its financial viability.
When a brand sees a good CLV (at least 3X of CAC), it shows the product fits the market. The campaigns are building customer loyalty and bringing recurring revenue from existing customers.
If you want to drive steady growth through customer loyalty, tracking your CLV is one of the best ways. A low rate can help you identify the issue and design your campaigns focused on retaining customers.
There are two methods of measuring CLV:
Accumulated Data Method
This method can bring accurate results if you access your historical data. If you are a new brand or are a beginner in monitoring customer lifetime value, you can also use AI-powered to pull customer data from day 1. Here is the formula:
CLV = Order 1 + Order 2 + … + Order N (where N is the number of orders)
Average Estimate Method
You can calculate an average CLV if you don’t have intricate historical data. It calculates the average order value and the average number of orders you receive from each customer. All you have to do is follow the following formula:
CLV = AOV x N
After running every new campaign, track the changes in your CLV. If you see an increase, your marketing initiatives successfully nurture customer loyalty. If you find the rate stagnant or decreasing, the campaign needs improvements.
2. Net Promoter Score (NPS)
Want to know what your customers think about your brand? Monitoring your net promoter score is a sure-shot way to do that.
To calculate NPS, brands share a simple NPS survey with their customers. Then they put the collected answers into a formula to produce a single figure that measures customer satisfaction. It acts as the standard benchmark of customer loyalty and is popular among companies worldwide.
To measure NPS, ask: “How likely are you to recommend us to friends, colleagues, or business associates on a scale of 0-10?”
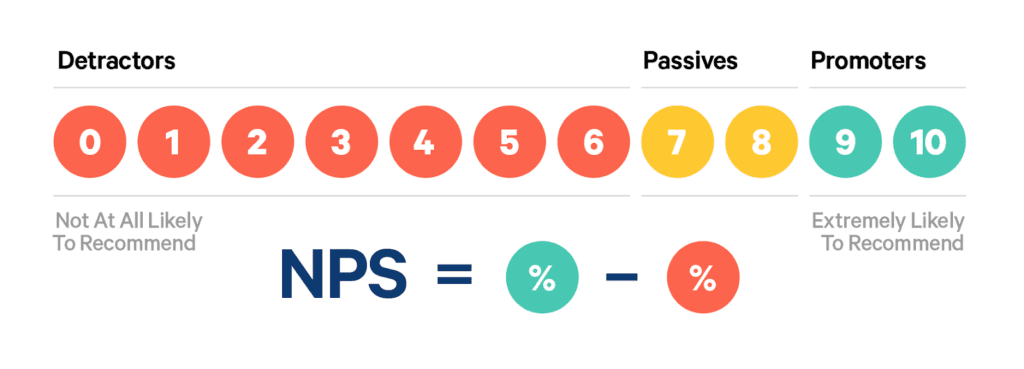
Based on the answers, determine the number of NPS promoters, NPS passives, and NPS detractors.
- Promoters: These customers assign a score from 9 to 10. They are more likely to generate value for your business over a long period. Once you identify them, focus on nurturing your relationship with them, the building continued loyalty through special programs, and understanding what you did right to replicate it in the future.
- Passives: People who assign a score of 7 or 8 are passives. These are your moderately satisfied customers. While they might be repeat buyers, they may switch to a competitor. So, reach out to them and try to collect more detailed feedback. Plan strategies that help passives keep you ‘top of mind’ and eventually move them toward the promoters column.
- Detractors: Customers who give you a score of 0 to 6 are called detractors. It indicates customer dissatisfaction and has the potential to damage your brand reputation through negative reviews, social media interactions, or word-of-mouth. Your best bet is to provide stellar service to bring them back on board. Ideally, your more experienced staff should deal with detractors and hear their problems. Then, they can provide a solution that caters to their specific complaints.
While passive customers are common, too many detractors show that your customer loyalty programs need improvements.
The formula to calculate NPS:
Average NPS= % of promoters - % of detractors.
To determine the average NPS score, businesses can conduct customer surveys, gather data, and compare their results with the industry benchmarks. This will give them a baseline to work with and set realistic goals for improvement.
Once the average score has been established, focus on delivering top-notch customer service. This can be achieved by creating a customer-centric culture, investing in employee training, and continuously implementing feedback systems to monitor and improve customer satisfaction.
And don't forget to do customer sentiment analysis on your open feedback!
Neal Taparia, from Cribbage Online, explains, “Running an NPS these days is straightforward and simple. We use shrink wrap software to regularly launch NPS surveys and understand how our customers view our games.”
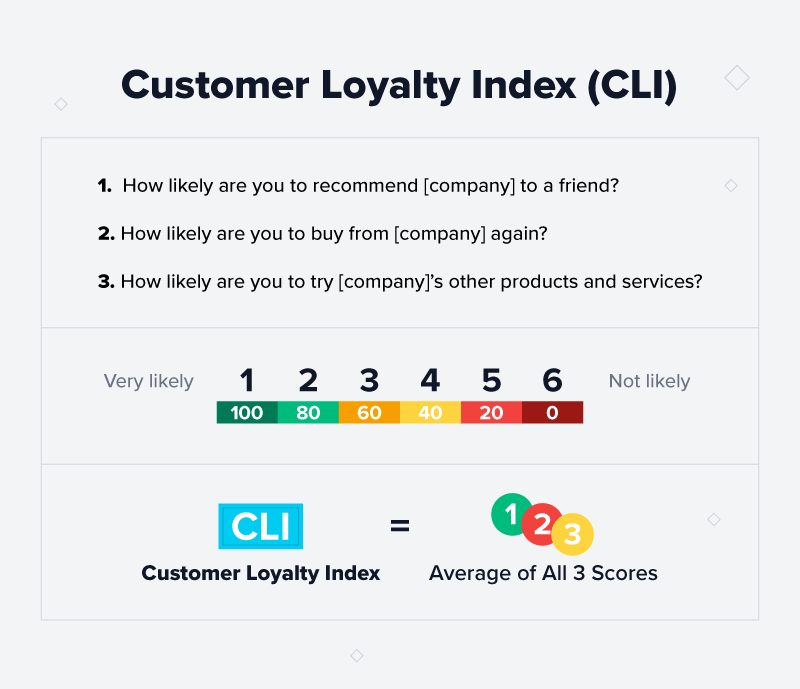
3. Customer Loyalty Index
The customer loyalty index (CLI) considers NPS, repurchase ratio, and upselling ratio elements. It’s a metric used to measure the strength of a customer's attachment to a particular brand. It's a valuable tool for marketers because it helps them understand how well they retain customers and identify areas for improvement.
Companies determine this metric by asking their customers three primary questions:
- How likely are you to repeat your purchase from our brand?
- How likely are you to try some new products from our brand?
- How likely are you to recommend us to friends and family?
However, approaching your customers with survey questions must be balanced. While they offer a detailed insight into your customer loyalty, you must be mindful of the frequency. This will keep your initiatives from overwhelming your customers.
CLI considers elements related to NPS, repurchase ratio, and upselling ratio. You calculate it by considering customer satisfaction, retention, and brand advocacy factors. The higher the CLI score, the stronger the customer's attachment to the brand.
Tracking CLI is important since it provides insights into customer behavior and helps them make data-driven decisions. For example, a low CLI score may show that customers are unhappy with a product or that the competition offers a better experience. In this scenario, businesses can take action to address the issue and improve the customer experience.
In contrast, a high CLI score can signify customer satisfaction and brand loyalty, leading to repeat business and positive word-of-mouth marketing. A study found customers who are highly loyal to a brand spend 67% more than new customers.
4. Customer Retention Rate
To know the efficiency of your campaigns in keeping loyal customers, you need to calculate your customer retention rate at frequent intervals. It’s the percentage of existing customers who keep purchasing from you after a period.
Calculating CRR metrics will help you understand what keeps your customer base loyal to your company. You can identify opportunities to improve customer service by monitoring its increase or decrease. With merely 42% of brand execs believing their customer loyalty plans are impactful, you must customize your marketing collateral to improve your stats and turn your new customers into loyal brand advocates.
To calculate the customer retention rate, you need to choose a period you want to measure. The next step is to identify the following metrics:
- Number of customers at the start of a given time (A)
- Number of customers at the end of that period (B)
- Number of new customers added throughout that period (C)
The formula for the calculation is: Customer retention rate = [(B-C)/A] x 100
A great example of a brand increasing its retention rate is Coca-Cola. Their ‘Share A Coke’ campaign was a masterpiece in personalization, wherein the most popular names were printed on Coke cans in Australia. This urged consumers to buy cans with either their name or their friend’s names printed on them.
Coca-Cola reported increased sales and brand awareness because of the campaign. The personalization aspect of the campaign resonated with its consumers, leading to the brand expanding the campaign in New Zealand and Asia next. Since the campaign performed extremely well, Coca-Cola extended it across the globe.
The U.S. version was ‘Share a Coke and a song’. The campaign helped Coca-Cola appeal to a younger demographic likelier to share and interact with the personalized products. It helped to revitalize the brand since its focus shifted from product to building emotional connections. By encouraging customers to share their experiences and products on social media (125,000+ posts), Coca-Cola could evoke a positive sentiment in its audiences.
5. Brand Advocacy
A brand advocate loves your brand and actively supports and promotes your products and services. They refer your company to their friends, families, and acquaintances and help you generate more sales.

Your marketing initiatives increase brand visibility and complement your advocacy efforts. By measuring brand advocacy, you can gauge how successfully you built customer loyalty through your marketing endeavors.
You can measure brand advocacy by evaluating shares, positive reviews, campaign hashtag usage, etc. Measuring these KPIs will help you understand the efficacy of your marketing programs.
Here are the top 4 metrics you need to measure to calculate brand advocacy for your business:
- Positive reviews: The number of positive reviews you get after every new campaign or product launch indicates a sizeable chunk of brand advocates.
- Social shout-outs: Track how many people share your content and endorse your brand on their socials. Monitor every channel you are running your campaigns on.
- Product page shares: Examine how many visitors share your product pages while browsing your website.
- Campaign hashtag usage: Monitor how many followers use your campaign hashtags.
Tracking these metrics after every new campaign will help you measure the changes in customer loyalty. With a holistic view of brand advocacy, you can gauge your marketing performance and bring the changes to improve.
6. Referral and Positive Word-of-Mouth
The number of referrals you get from your customers is an excellent indicator of customer loyalty. When existing consumers are impressed with your services, they naturally spread the good word.
By keeping track of these numbers, you can measure how your marketing campaigns are boosting customer loyalty.
Add a referral section to the sign-up form on your website. This will help you monitor the numbers and make accurate calculations.
Take the Walmart+ referral program as an example. They offer $20 for each successful referral and other membership perks.
For tracking referrals, marketers can use a unique referral code for each customer, which they can share with their friends. You can create a referral code with different referral tools.
You can track the following key metrics to measure the success of your referral campaign:
- Conversion rate: The number of people who sign up using the referral code versus the number of clicks on the referral link.
- Lifetime value (LTV): The total revenue a referred customer generates over their lifetime.
- Referral rate: The number of referrals each customer generates gives you an idea of how well the referral program resonates with your existing customer base.
- Cost per acquisition (CPA): The cost of acquiring a new customer through referral marketing compared to other channels.
By tracking these metrics, you can gain insights into the effectiveness of your referral program, optimize your marketing efforts, and improve the customer experience. You can also track engagement metrics like click-through and open rates for referral emails to understand how well your referral messaging resonates with your customers.
Conclusion
Measuring the success of your marketing campaigns in tangible terms can seem like a complicated process to master.
But with regular tracking of NPS, customer retention rate, repurchase rate, etc., you identify opportunities for your customer loyalty programs. While conversion rate may seem like the most important KPI to measure, do not lose sight of seemingly inconsequential metrics.
Every business is unique, and you must choose customer satisfaction metrics and KPIs that align with yours – and design your customer experience accordingly.
The wisest thing to do here is to experiment with different indicators and see what combination brings you the most accurate results.