Top Elements of a Comprehensive Survey Report


Creating a comprehensive survey report is crucial for turning raw customer feedback data into actionable insights.
A well-structured report not only helps in understanding the results but also in making informed decisions.
Here, I’ll walk you through the top elements that make up a survey report, ensuring you can effectively communicate your findings.
Survey Report – 101
1. Executive Summary
The executive summary is a brief overview of the survey report, highlighting the main findings, conclusions, and recommendations. It should be concise yet informative, allowing readers to quickly grasp the key points without going through the entire report.
Key Points:
- Purpose of the Survey: Why the survey was conducted.
- Main Findings: Summarize the most important data points.
- Conclusions and Recommendations: What actions should be taken based on the findings.
2. Introduction
The introduction provides context for the survey. It includes background information, the objectives of the survey, and the questions it aims to answer. This section sets the stage for readers, helping them understand the purpose and scope of the survey.
Key Points:
- Background Information: Relevant context about the topic.
- Survey Objectives: What you intended to achieve.
- Research Questions: Specific questions the survey aims to address.
3. Methodology
Detailing the methodology is essential for transparency and credibility. This section explains how the survey was conducted, including the design, sampling methods, data collection processes, and any limitations.
Key Points:
- Survey Design: Type of survey and why it was chosen.
- Sampling Methods: How participants were selected.
- Data Collection: Tools and techniques used to gather data.
- Limitations: Any constraints or biases that might affect the results.
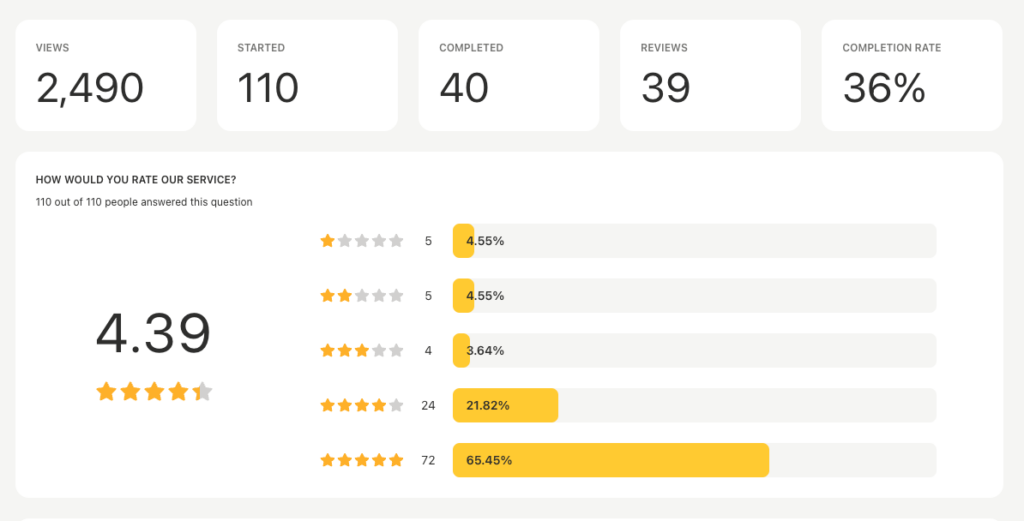
4. Data Analysis
Data analysis is the heart of your survey report. This section presents the findings through various data visualization techniques like charts, graphs, and tables. It should be easy to interpret and highlight significant trends and patterns.
Key Points:
- Descriptive Statistics: Mean, median, mode, etc.
- Visualizations: Use of charts and graphs to represent data.
- Key Insights: Major trends and patterns observed.
5. Findings
The findings section provides a detailed account of the survey results. Each question should be addressed, with the corresponding data presented and analyzed. This section should be organized logically, often by grouping similar questions together.
Key Points:
- Question-by-Question Analysis: Detailed examination of each survey question.
- Supporting Data: Tables and charts that illustrate the findings.
- Narrative: Explanation of what the data means.
6. Conclusions and Recommendations
Based on the findings, the conclusions and recommendations section provides actionable insights. This part of the report should clearly state what the data suggests and propose steps to be taken.
Key Points:
- Conclusions: What the data reveals.
- Recommendations: Actions to address the findings.
- Future Research: Suggestions for further studies if necessary.
7. Appendices
The appendices include supplementary material that supports the report but is too detailed to include in the main sections. This can consist of raw data, additional charts, or detailed methodologies.
Key Points:
- Raw Data: Full data sets used in the analysis.
- Additional Charts: Extra visual aids that support the findings.
- Detailed Methodologies: In-depth explanation of the methods used.
8. References
Citing sources enhances the credibility of your report. Any external sources or previous studies referenced in the report should be listed here.
Key Points:
- Source Citations: Properly formatted references.
- Previous Studies: Acknowledgment of earlier research.
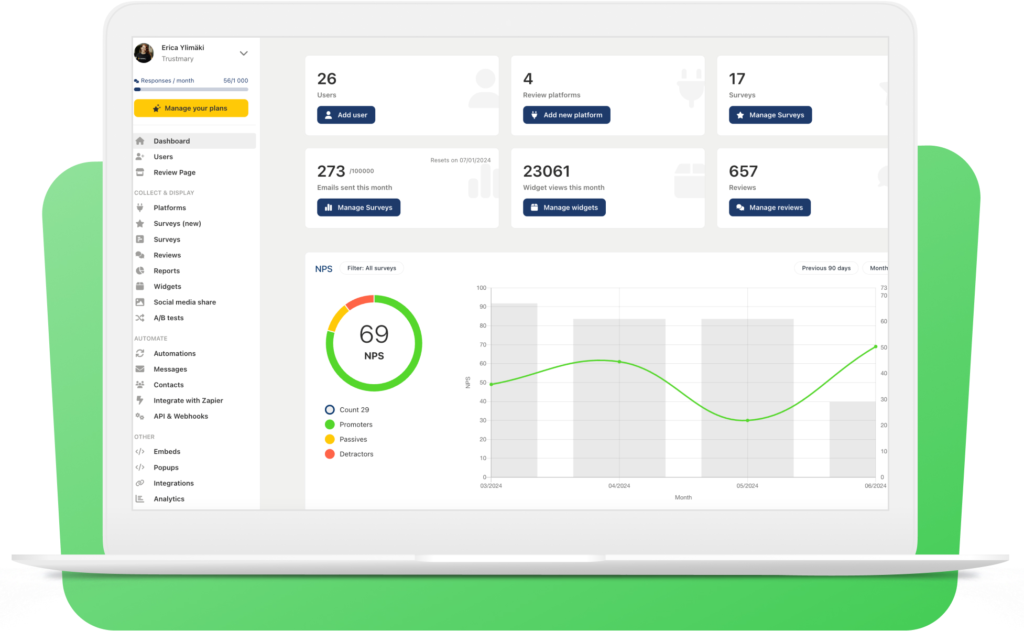
Trustmary's Automatic Live Survey Report
At Trustmary, we take customer satisfaction reporting to the next level with our automatic live reporting feature.
In fact, you don't need to lift a finger to create the survey report.
Instead of exporting data and sending it as a PDF, you can share survey results with a password-protected link.
This ensures that stakeholders have real-time access to the most up-to-date information without the hassle of manual updates.
Our system provides an efficient and secure way to keep everyone informed and engaged with the latest insights.
FAQ
What is the purpose of a survey report?
A survey report compiles and presents the data collected from a survey in an organized and understandable way. Its purpose is to analyze the data, draw conclusions, and provide recommendations based on the findings.
How do I write a good executive summary for a survey report?
A good executive summary should include the purpose of the survey, key findings, conclusions, and recommendations. It should be concise, clear, and provide a quick overview of the entire report.
What types of visualizations are best for survey data?
Charts, graphs, and tables are commonly used to visualize survey data. Bar graphs, line graphs, pie charts, and scatter plots can help highlight trends, comparisons, and relationships within the data.
How can I ensure my survey report is unbiased?
- Use clear and neutral language
- Provide transparent methodology
- Accurately represent the data without omitting any significant findings
- Address any potential limitations in the methodology section.
What should be included in the methodology section of a survey report?
The methodology section should include the survey design, sampling methods, data collection processes, and any limitations. It should explain how the survey was conducted and why certain methods were chosen.