Survey reporting
Gain Deeper Insights with Feedback Reporting
Make data-driven decisions with comprehensive reporting features from Trustmary. Use custom reports to reveal the customer insights you need.
- Create and edit customized reports
- Analyze and track customer feedback
- Filter and segment survey data
- Share reports via multiple channels
Reports on customer experience and feedback
Trustmary provides you with clear, customizable, and shareable reports on your feedback surveys.
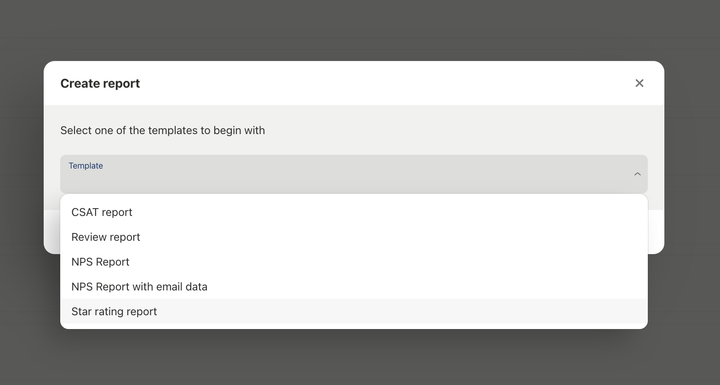
Create the report you need
Use our templates or compile the report piece by piece according to your needs.
- Use ready-made report templates or start from scratch.
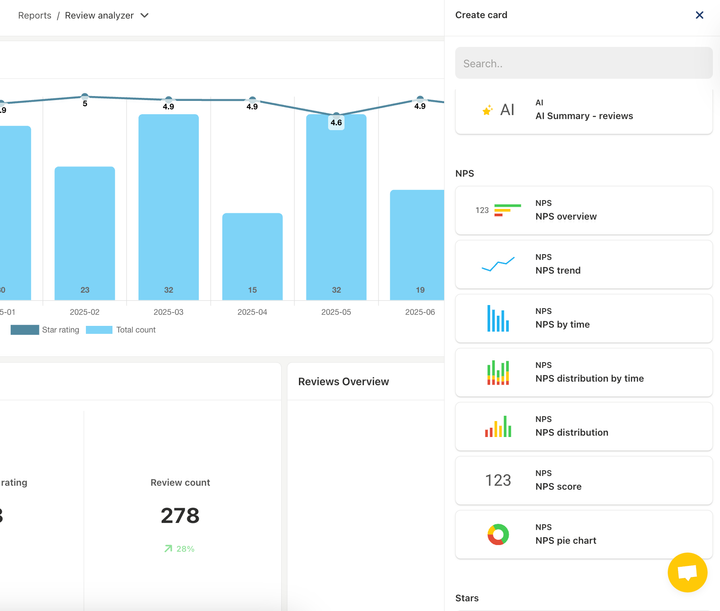
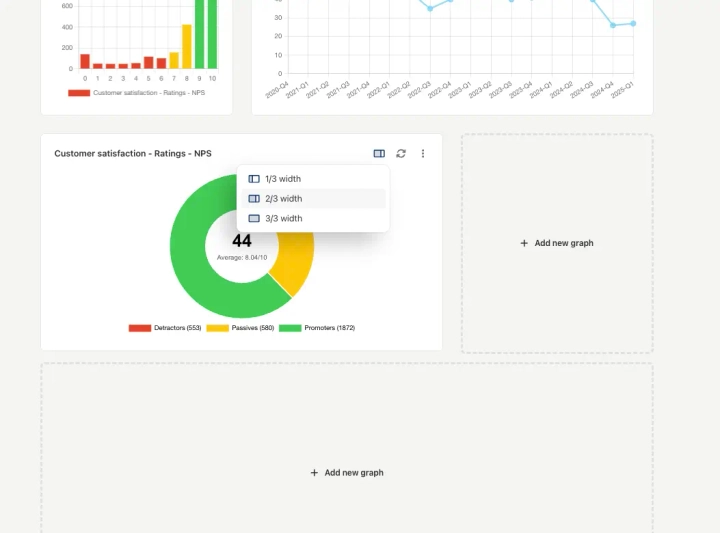
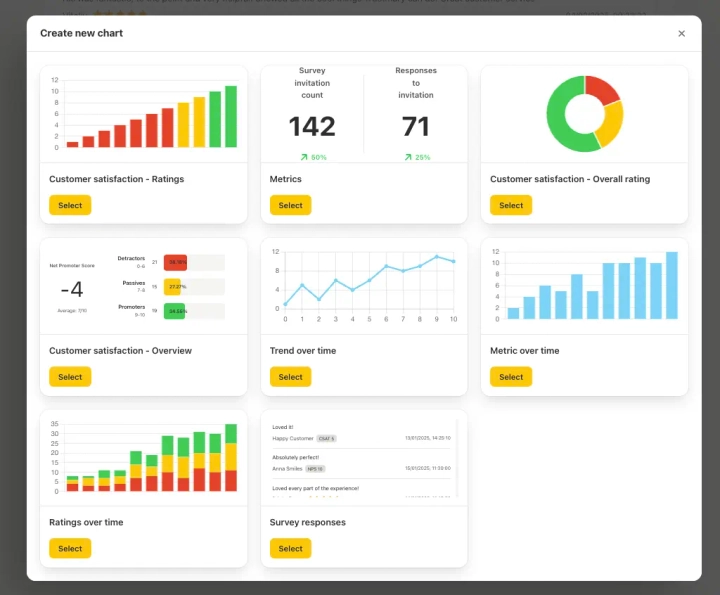
- Add report cards with different charts and data visualization techniques.
- Customize the report dashboard to your heart’s content.
Comprehensive survey summaries
Easily access detailed summaries of individual surveys for quick insights.
- Follow the performance of each survey.
- Highlight key feedback points from individual surveys.
- Track responses and view the survey summary.
Real-time data visualization
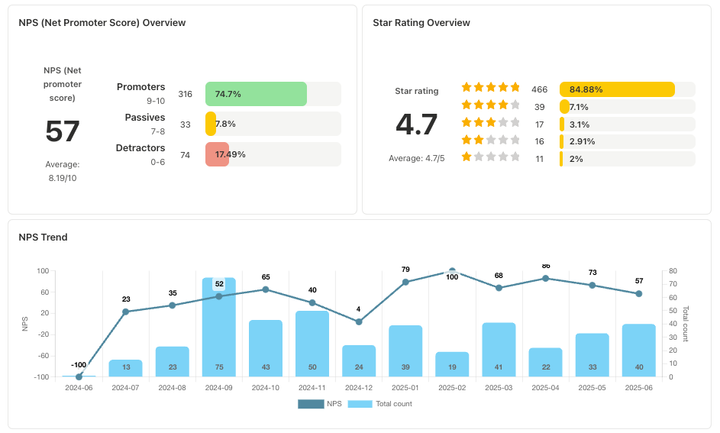
With just one glance, you can overview your customer satisfaction metrics.
- View cumulative results from chosen surveys.
- Use interactive graphs and charts.
- Monitor customer satisfaction trends over time.
Filter and segment results
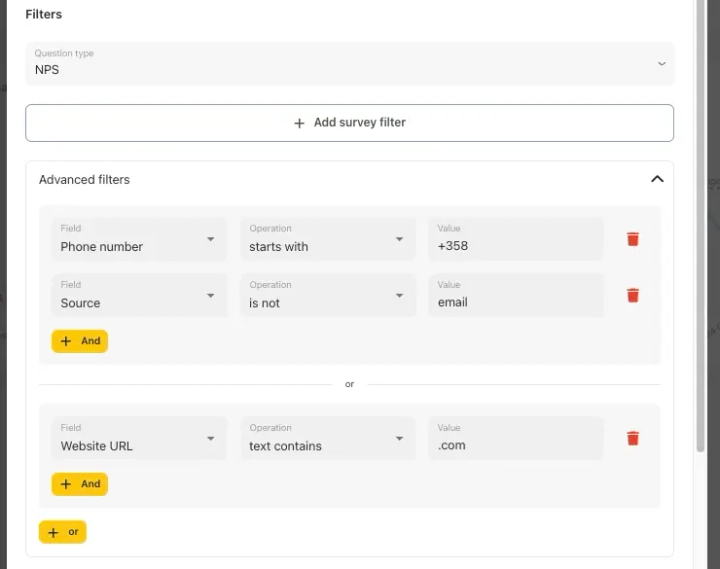
Reflect the survey answers in relation to specific parameters and segments to uncover more insights.
- Add different parameters and variables to your feedback forms.
- Create filtered reports based on those parameters and segment results.
- Gain an even deeper understanding of customer experience.
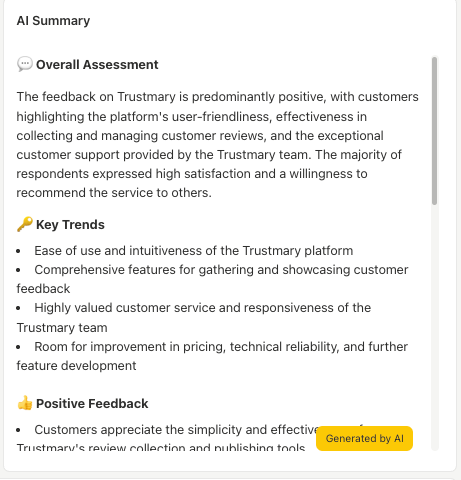
Actionable insights with AI summary
Quickly derive insights from a large number of responses with AI.
- Learn the overall sentiment customers have about you.
- See what type of positive, neutral, and negative feedback you have.
- Get actionable tips on how you can improve customer experience.
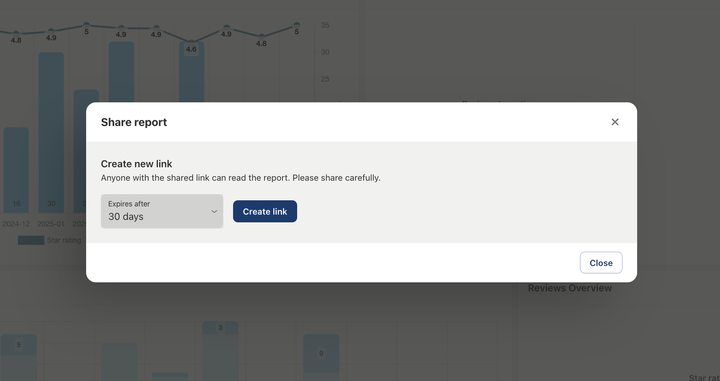
Share reports
Enhance team communication and report results to supervisors and stakeholders easily.
- Share direct links to dashboards.
- Download to your computer as a PDF and send via email.
- Export as PNG and add to your presentations.
Get flexible reporting features and automated feedback surveys.
Trustmary helps you collect and analyze feedback – and make use of it internally as well as externally.
Book a free demo with us or start exploring the tool by yourself.
Hear it from the people who know what they’re talking about
Get the exact report that you need
Whether you need to analyze your NPS trends or learn your customer’s opinions on a specific topic, we got you covered.
Templates based on your surveys
Trustmary creates a template based on what surveys you have used:
- NPS report
- CSAT report
- Star rating report
- Review analysis report
Create your own from scratch
Create new reports and edit templates as much as you would like.
- Add or remove report cards.
- Set your chosen filters or change them in real time.
- Modify the appearance of your report.
Use a variety of visual charts
Different charts are good for different use cases, and we all have our personal preferences. You can include all of them in one report!
- Build your report with several different report cards.
- Choose different data visualization types: line charts, bar charts, pie charts, numbers…
- Add as many different report cards as you want and need.
Individual survey report
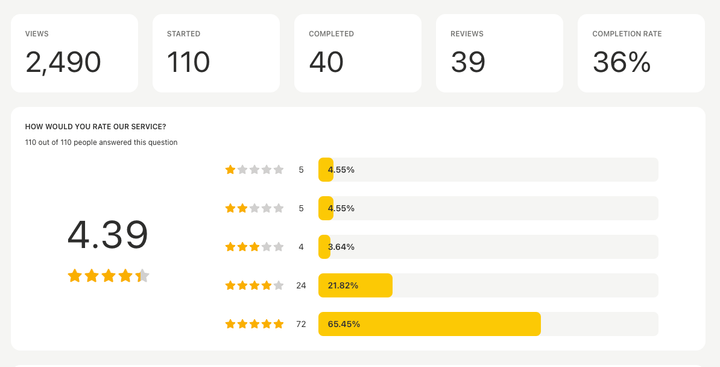
A survey report helps you visualize your survey answers and summarize any ratings you include.
- Response rate
- Average ratings
- View all answers
- Breakdown of each question
Analyzing feedback has never been easier
No more going through loads of survey responses manually and creating crazy excel sheets. Start saving time and reacting to feedback more efficiently.
Book a free demo with us to hear more, or start exploring Trustmary on your own – for free.
FAQ
Yes. You can share reports via links to your colleagues and protect reports from outsiders with a password. You can also invite colleagues to join your organization’s dashboard.
Additionally, you can export reports as PDF or PNG and share them in different channels: email, presentations, you name it!
Yes, they do. The reports are dynamic and updated with new data constantly. But if you wish, you can fix the time period you are reporting and create a static report, too.
Yes, you can. You can segment the data for example based on customer attributes like product purchased or by specific answers. Just make sure that the parameters you want to use are available for Trustmary in the first place.
Need more info?
We are happy to walk you through Trustmary’s feedback solutions in a free consultation.

